I simulated the 2022-2023 NHL regular season a million times to estimate what is likely to happen. (I used a computer to help me.) To estimate the probability of the home team winning each game I used my prediction model, Magnus. Curious readers will find lots of detail following that link, but, very briefly:
- I estimate the likely rosters for each team, starting from their contract list on
October 3, 2022, and then weighting by past playing time. Injuries and suspensions are taken
into account. For definiteness:
- All restricted free agents are expected to play a full season for their current teams;
- All PTO players are expected to not play;
- I estimate the individual impact of each player and head coach on:
- Shot generation and suppression, at even-strength and special teams, taking account of teammates, competition, and the effects of score, zone, coaching, and home-ice deployment;
- Rates of taking and drawing penalties
- Individual tendencies towards shooting or passing; and
- Ability to shoot or stop the puck, as appropriate.
- An adjustment for rest.
The method I used is strongly similar to the one I used last year, with some key improvements; some of the explanation is copied from last year's preview.
Team Summaries
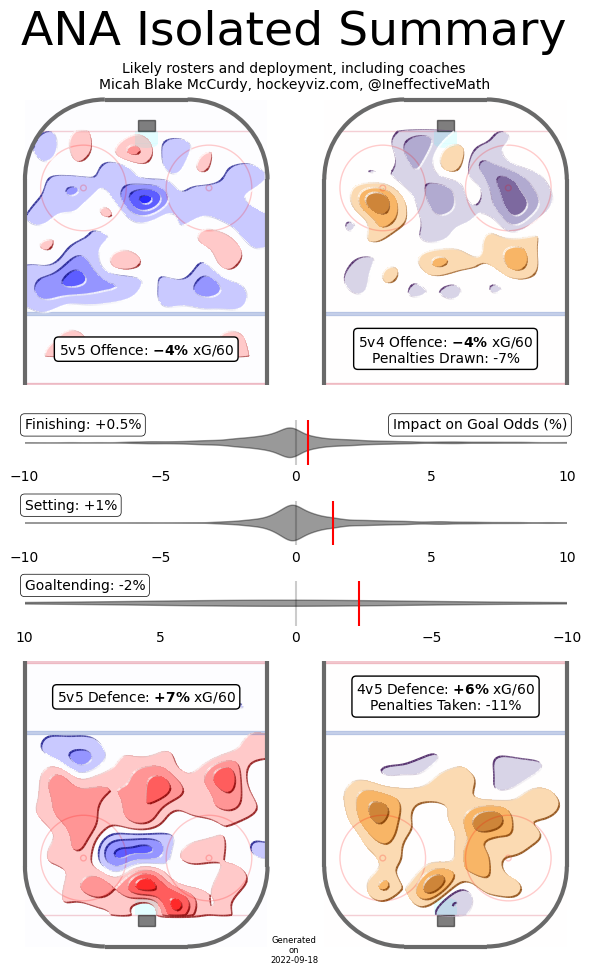
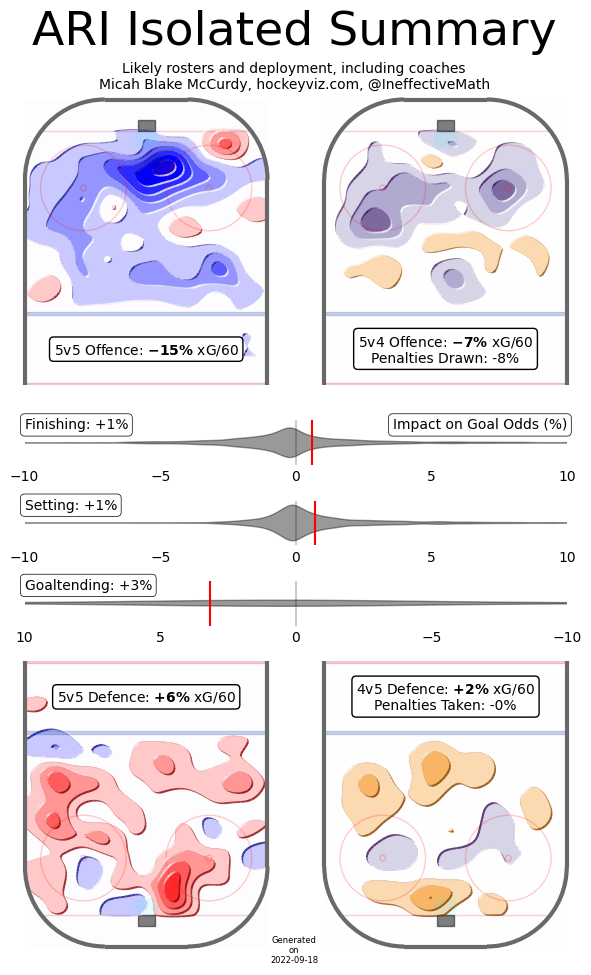
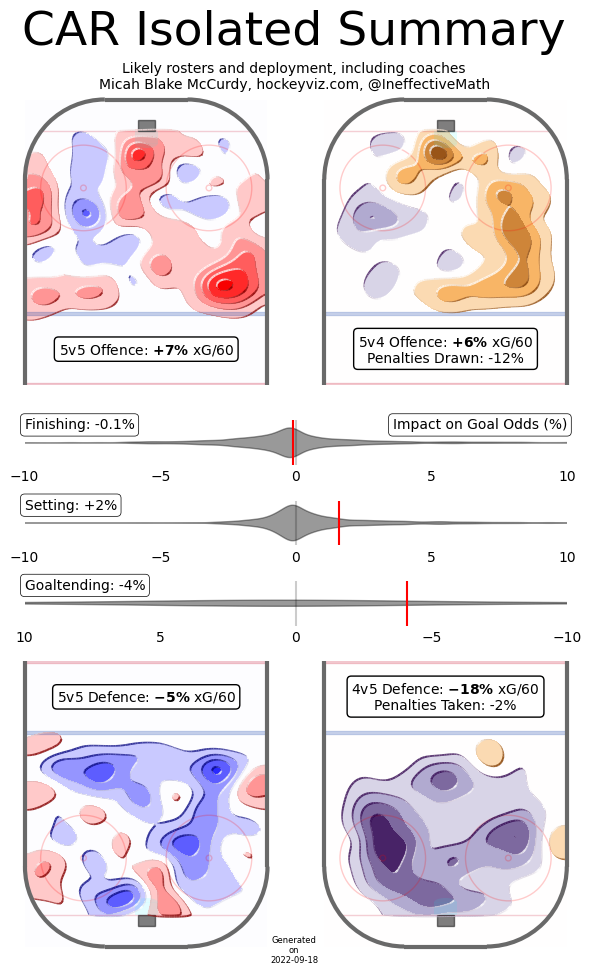
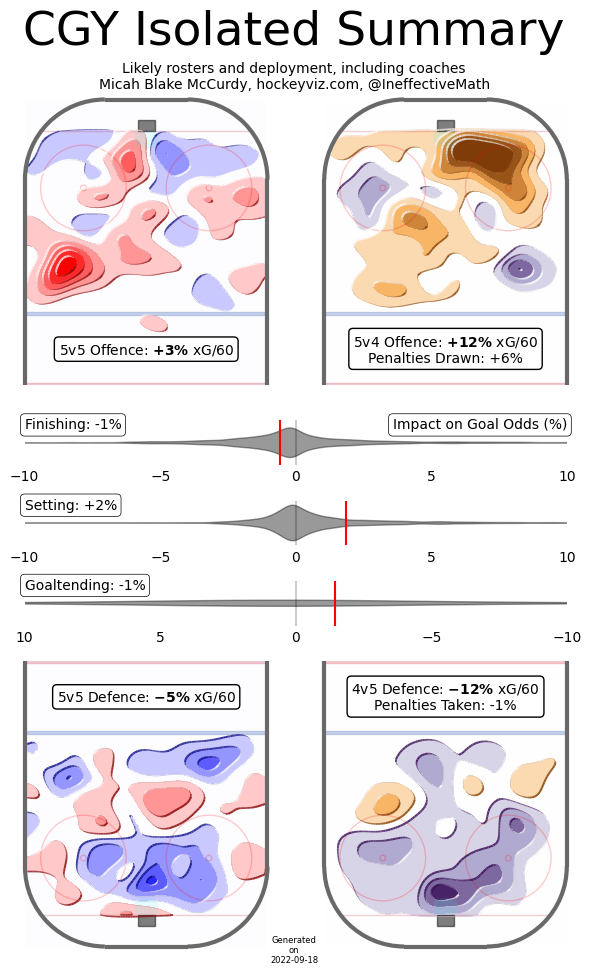
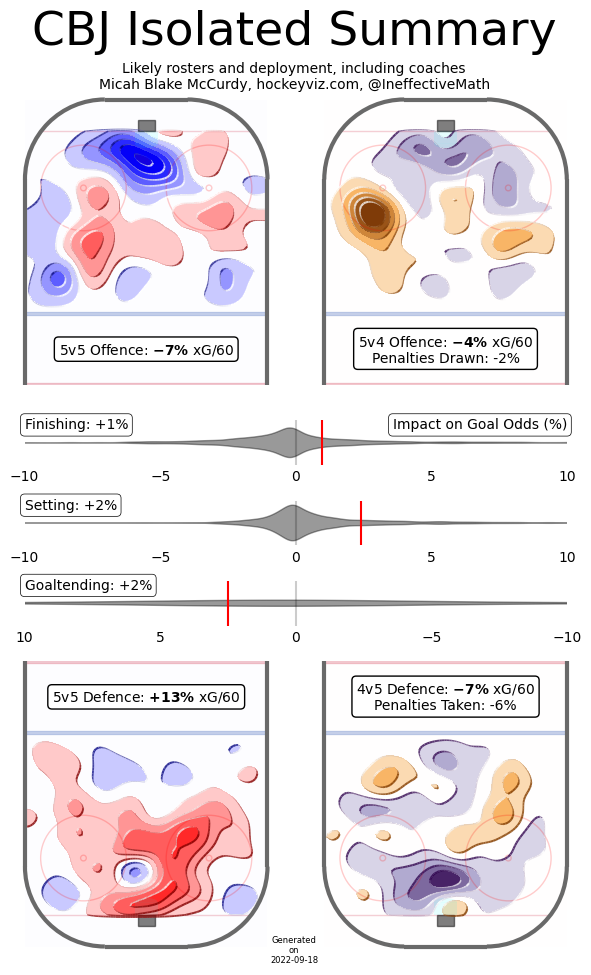
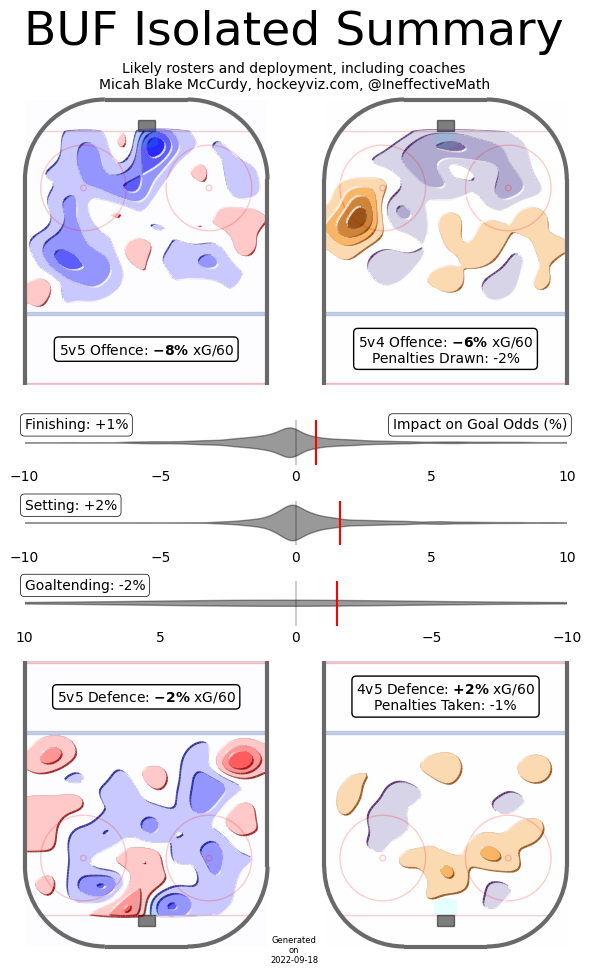
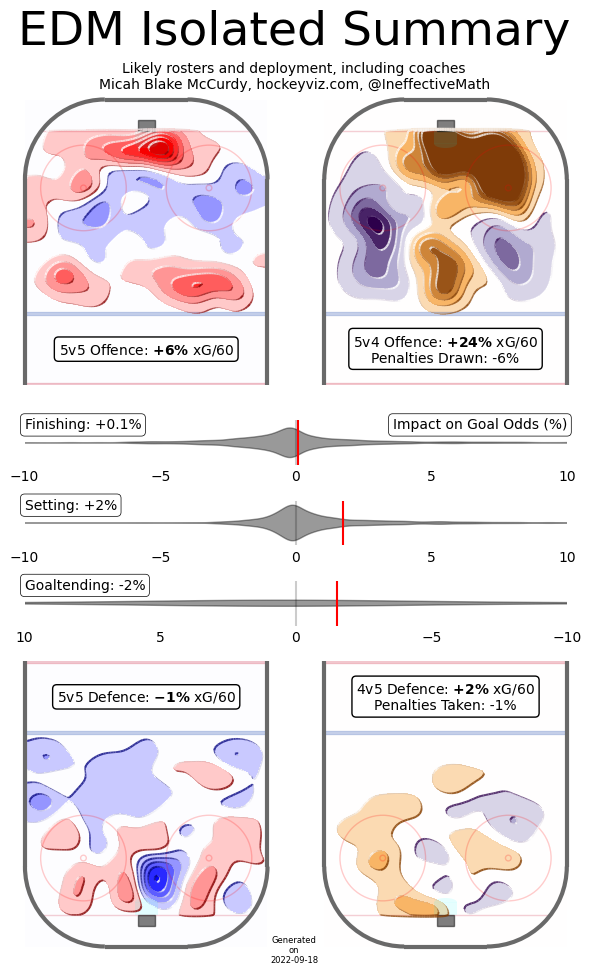
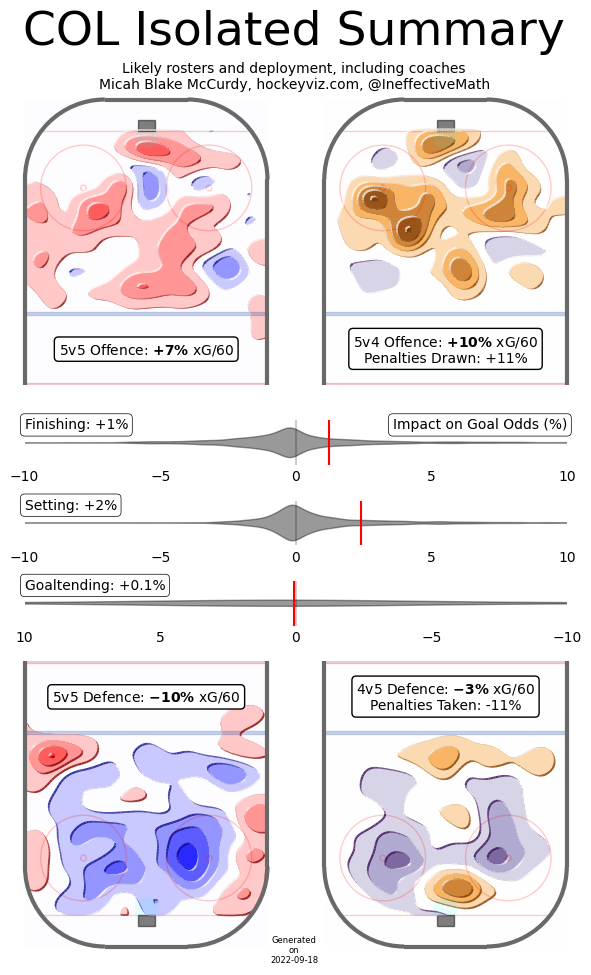
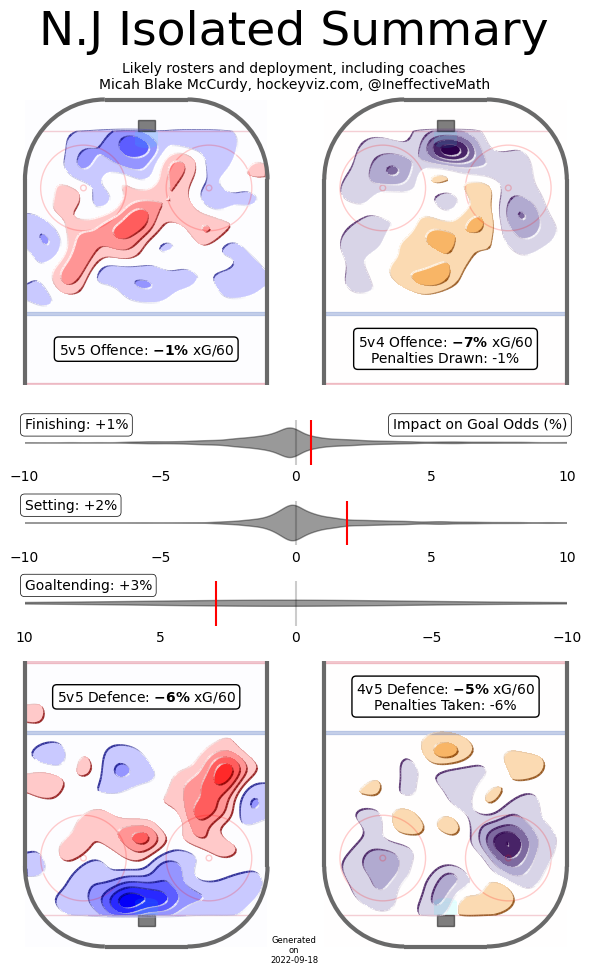
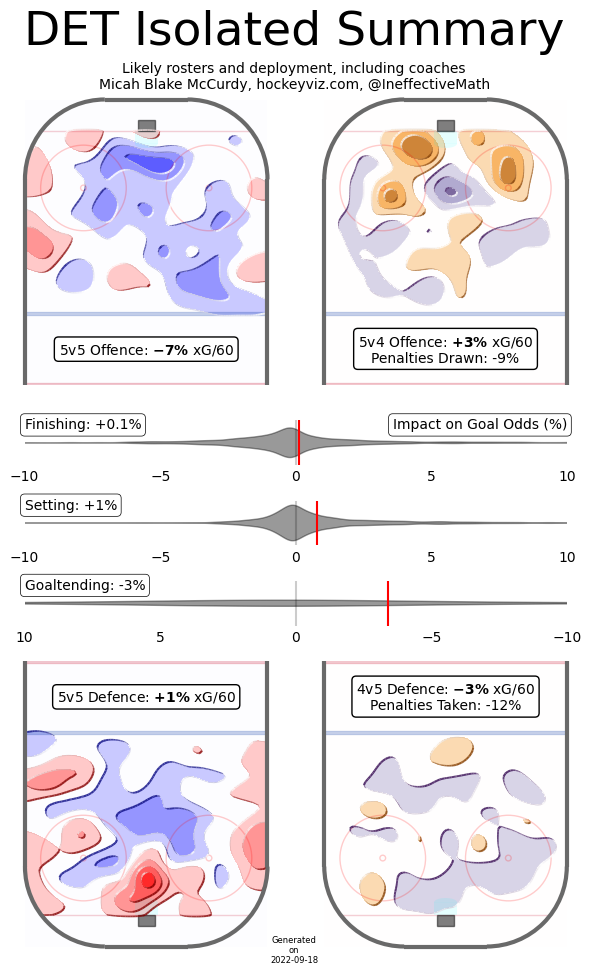
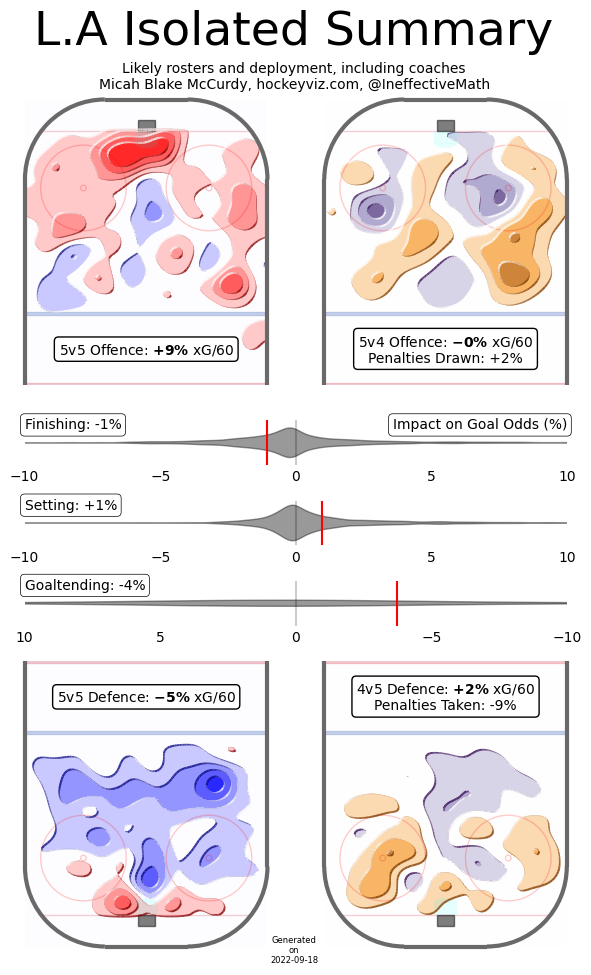
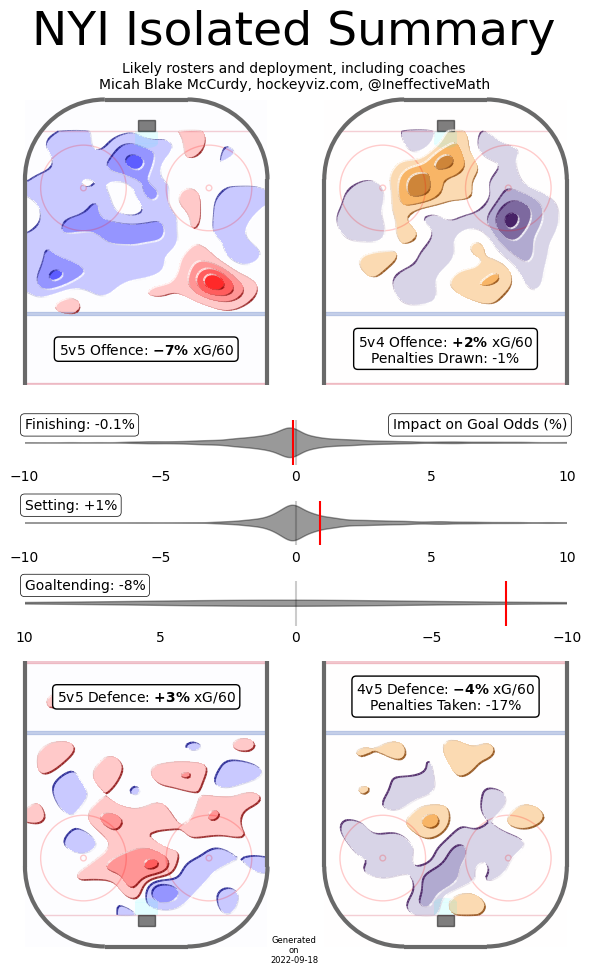
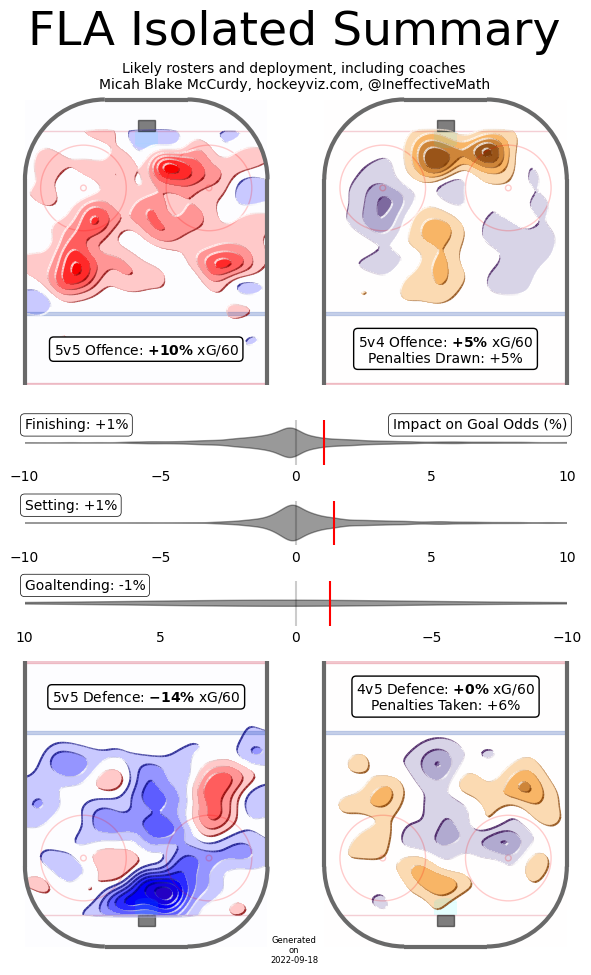
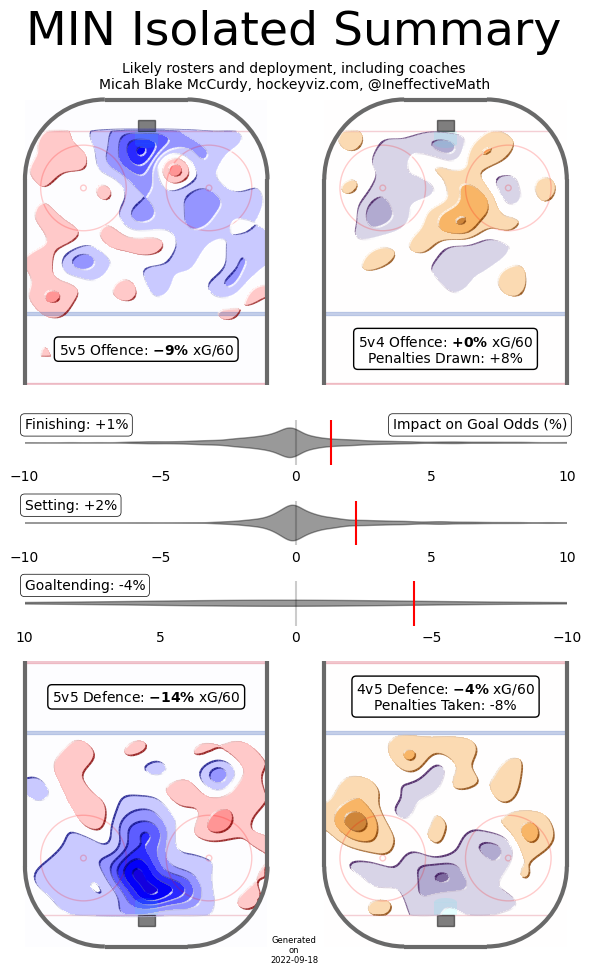
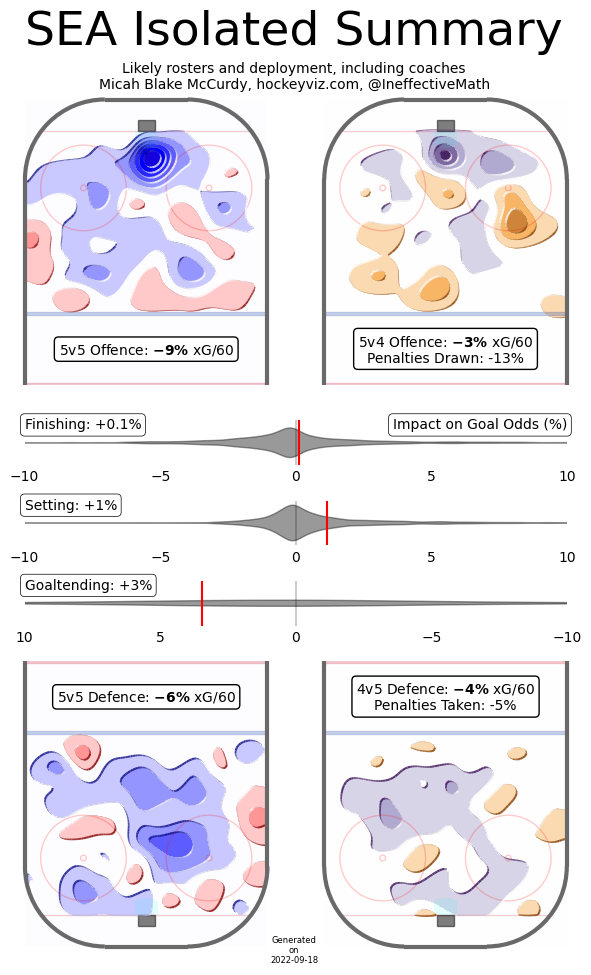
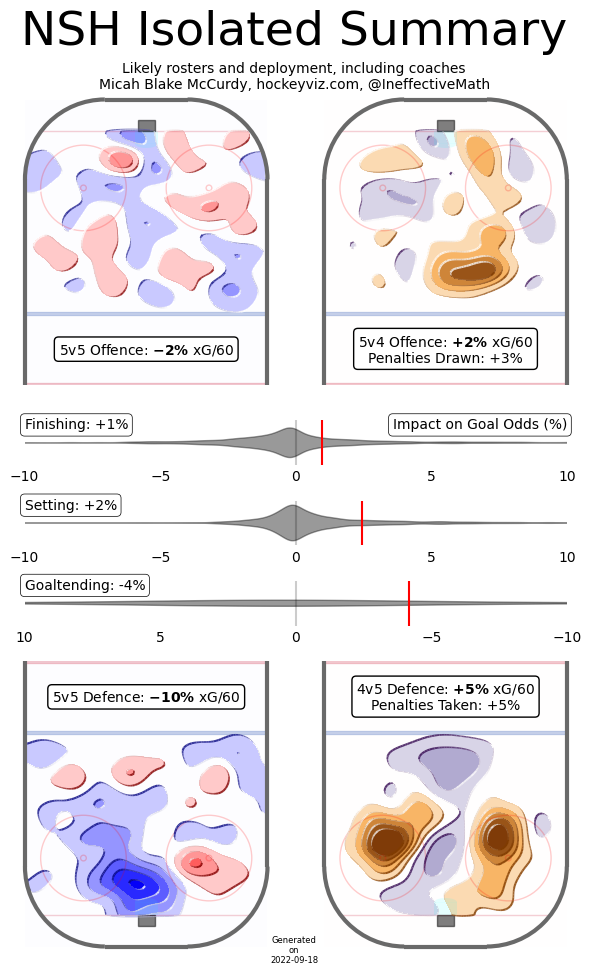
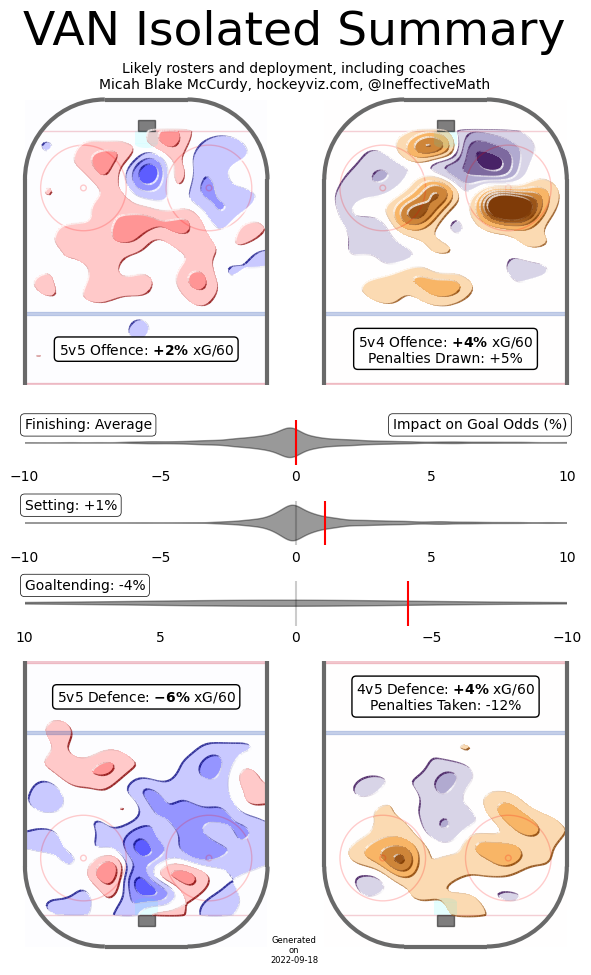
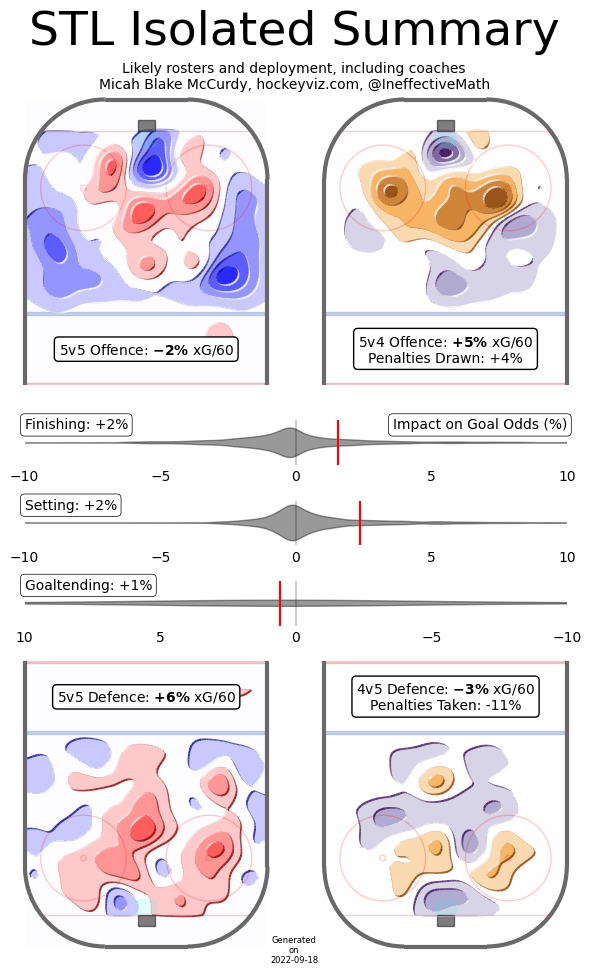
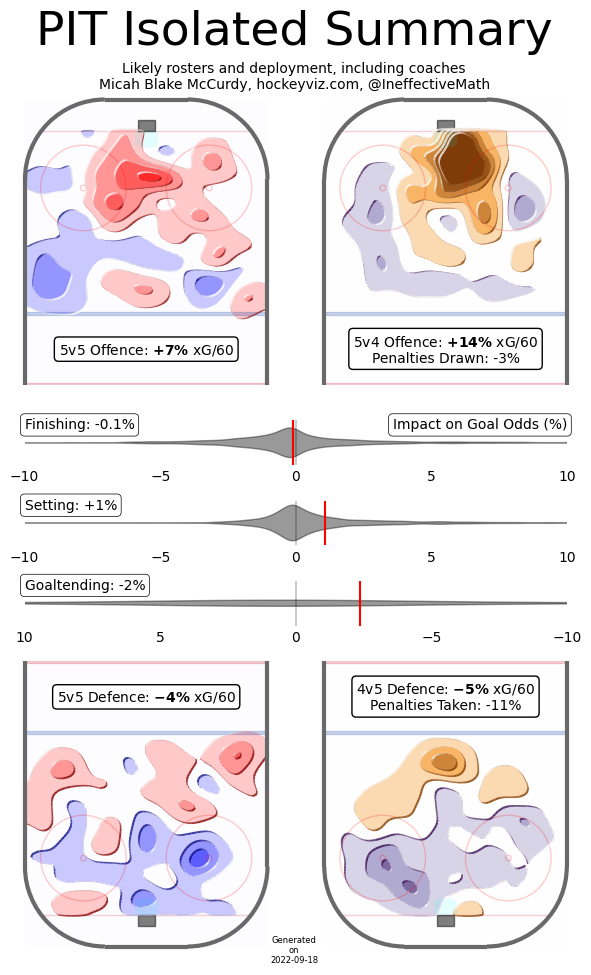
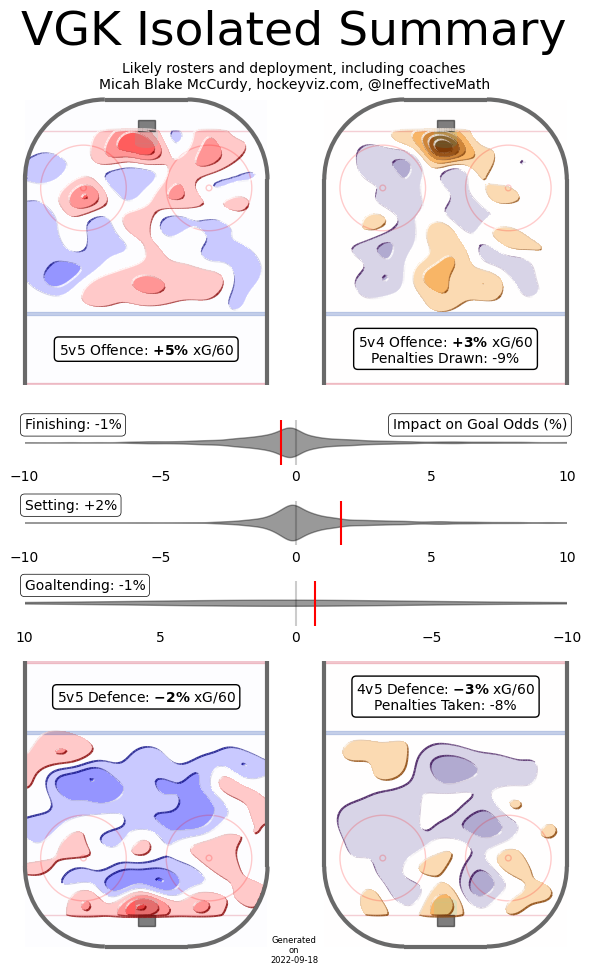
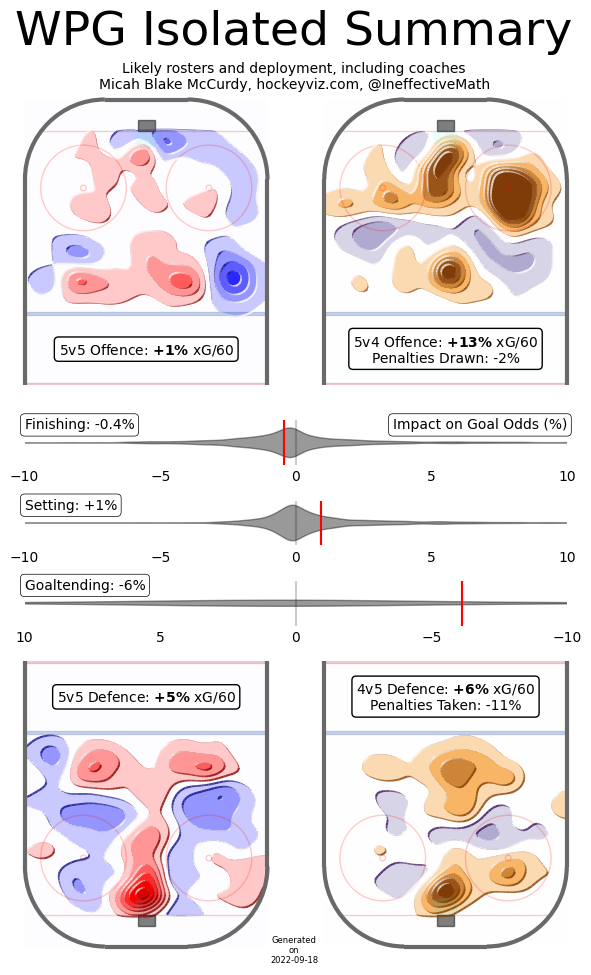
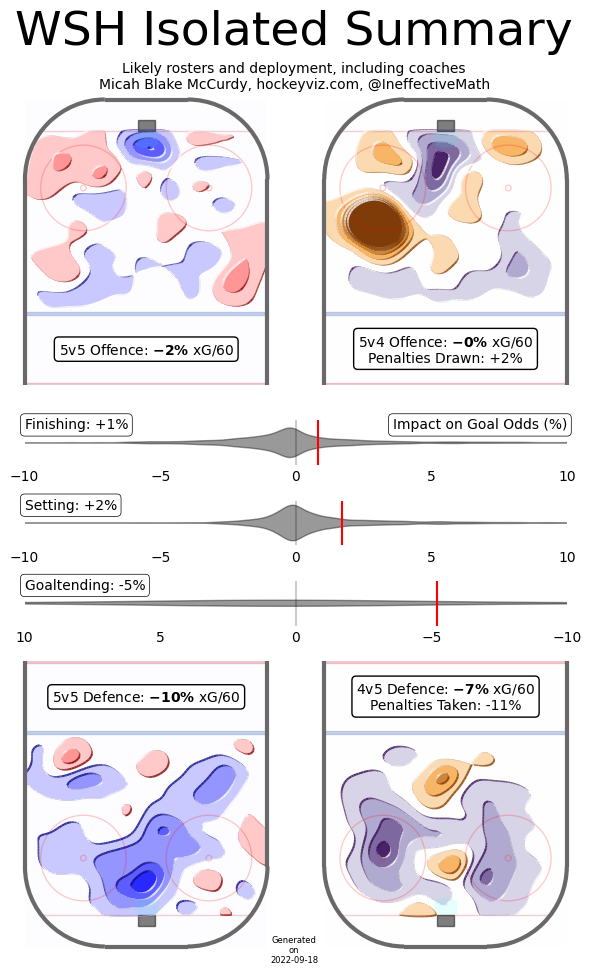
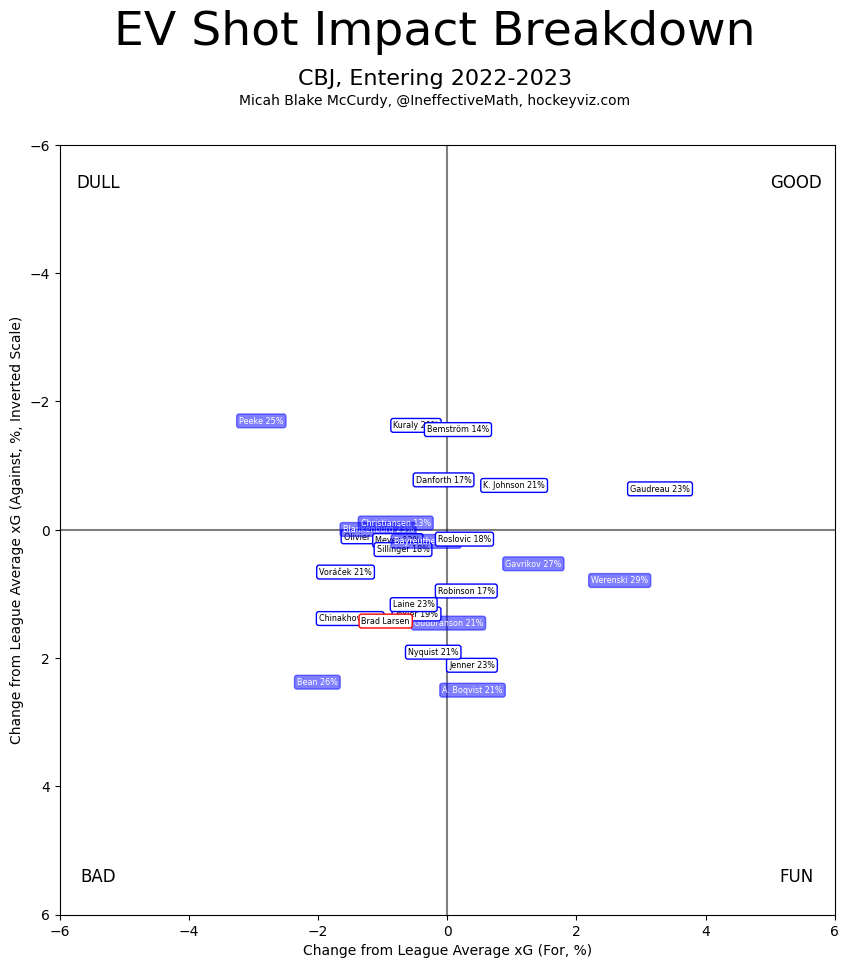
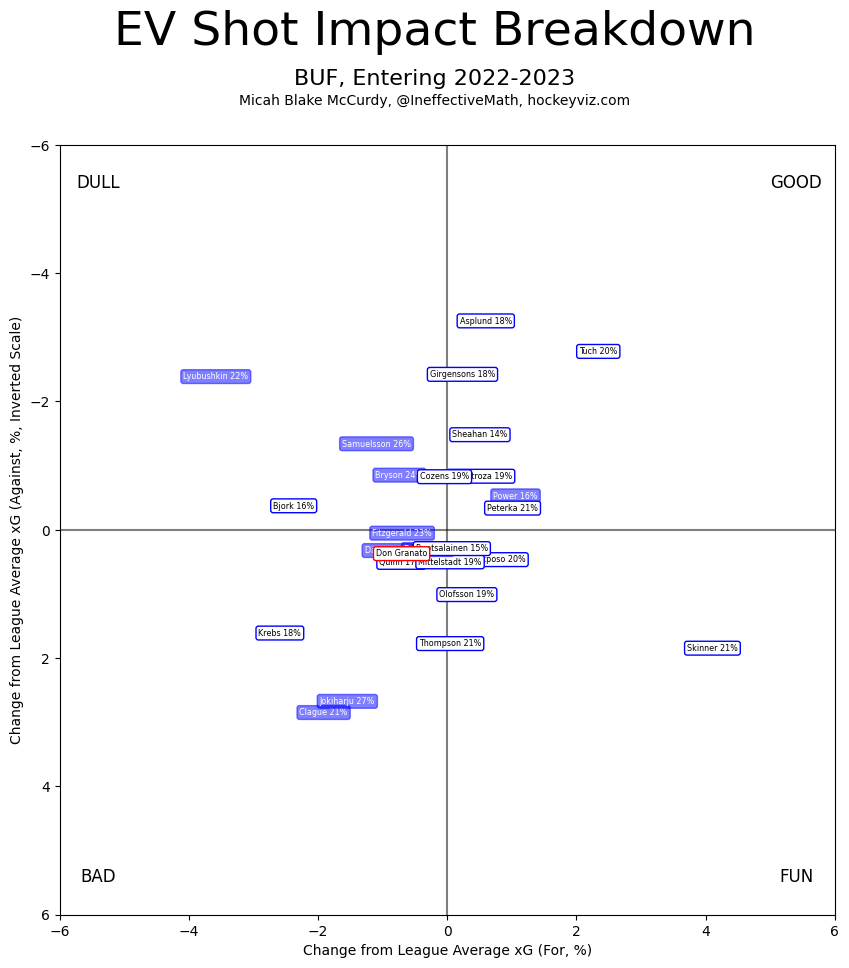
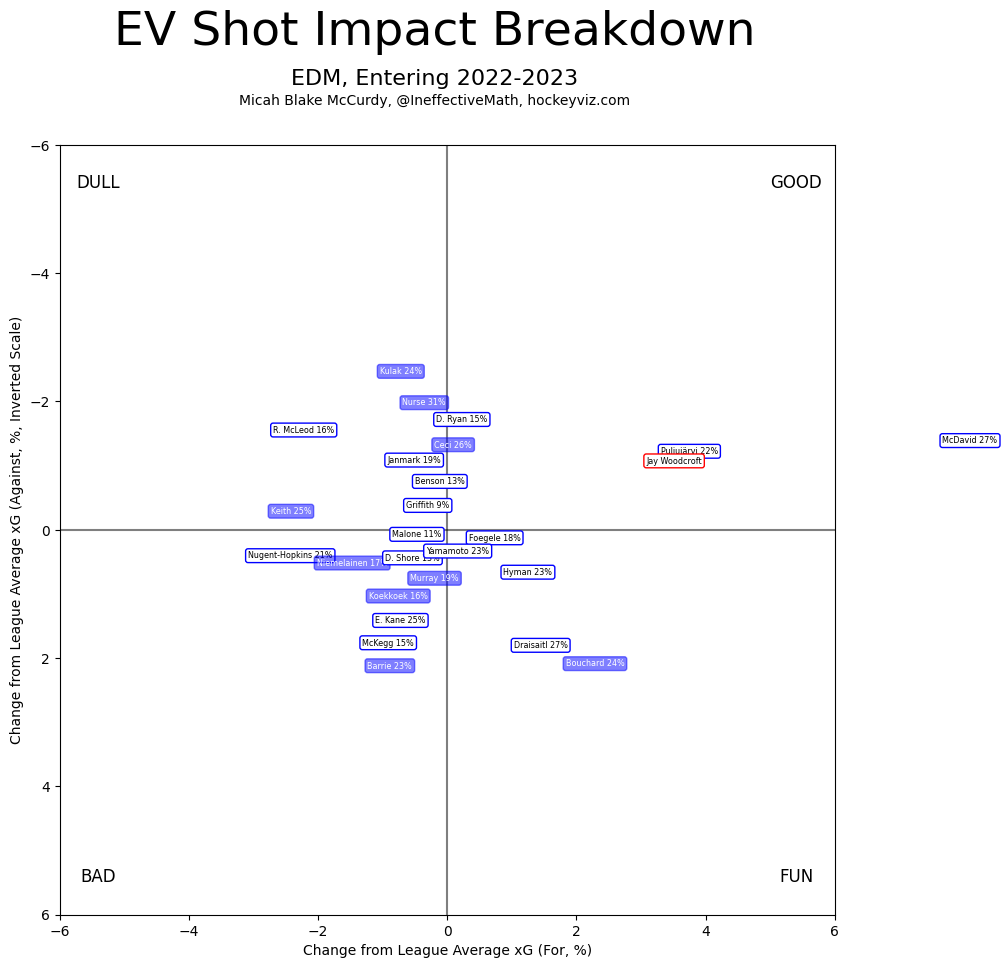
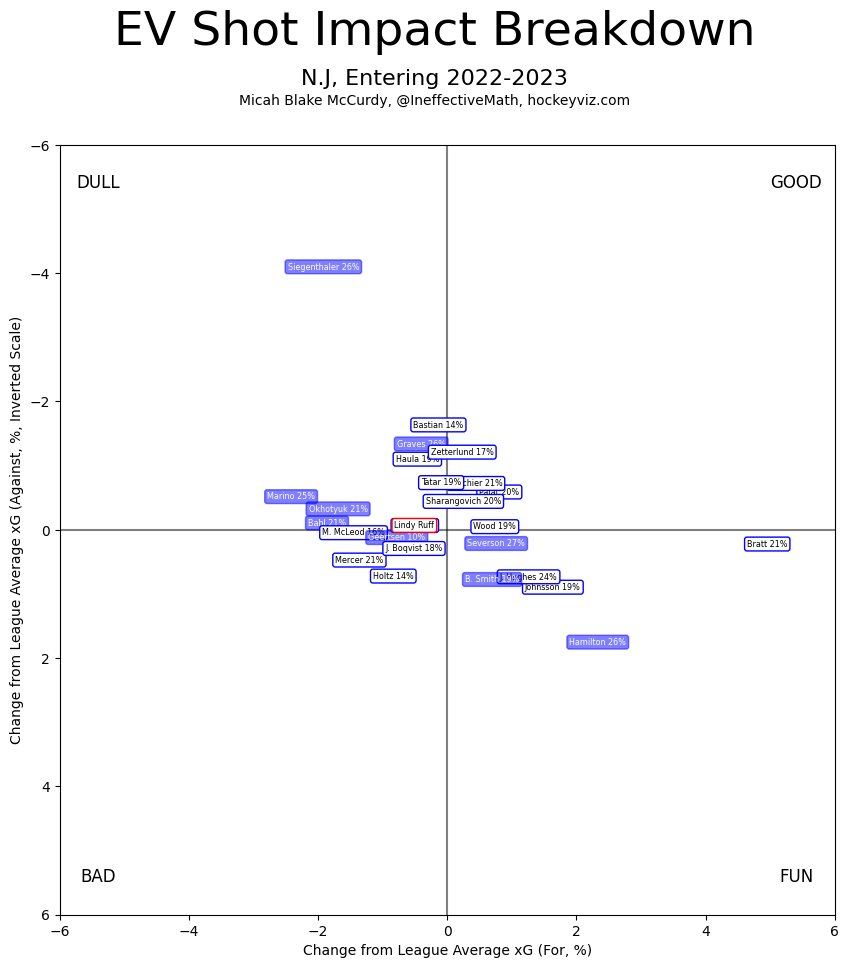
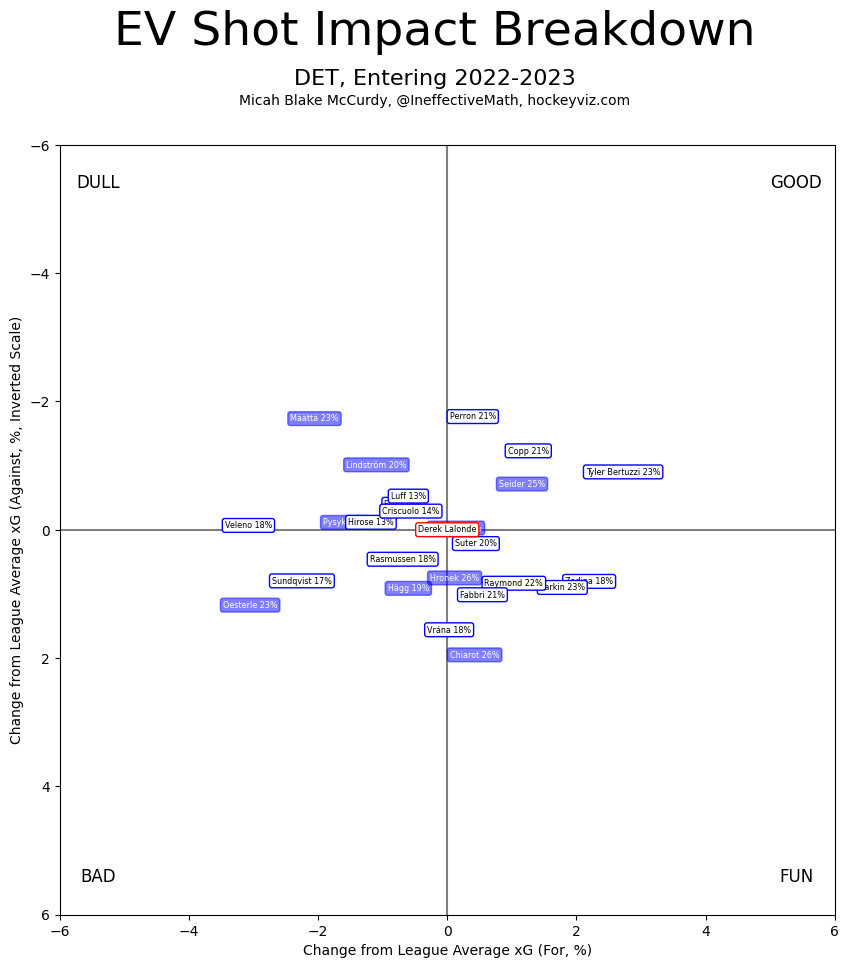
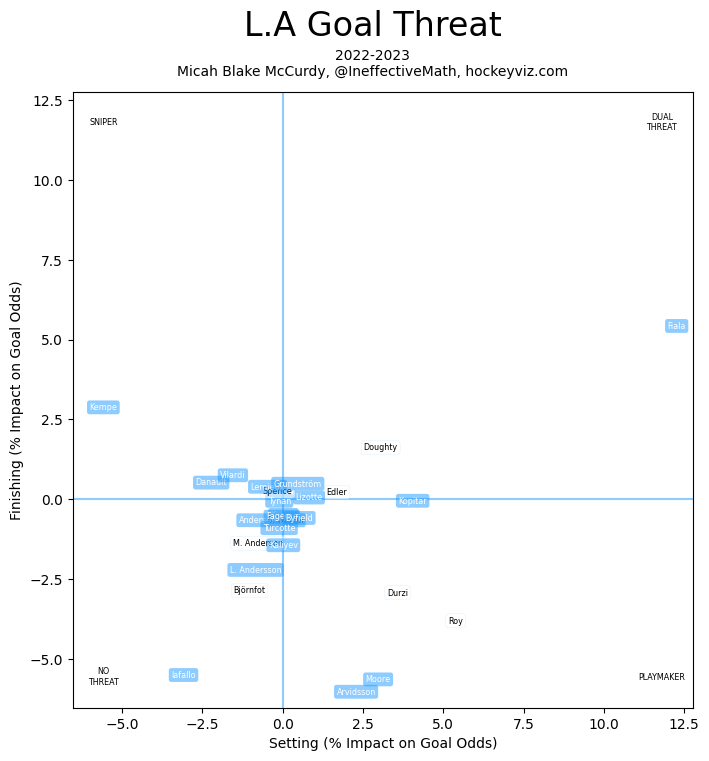
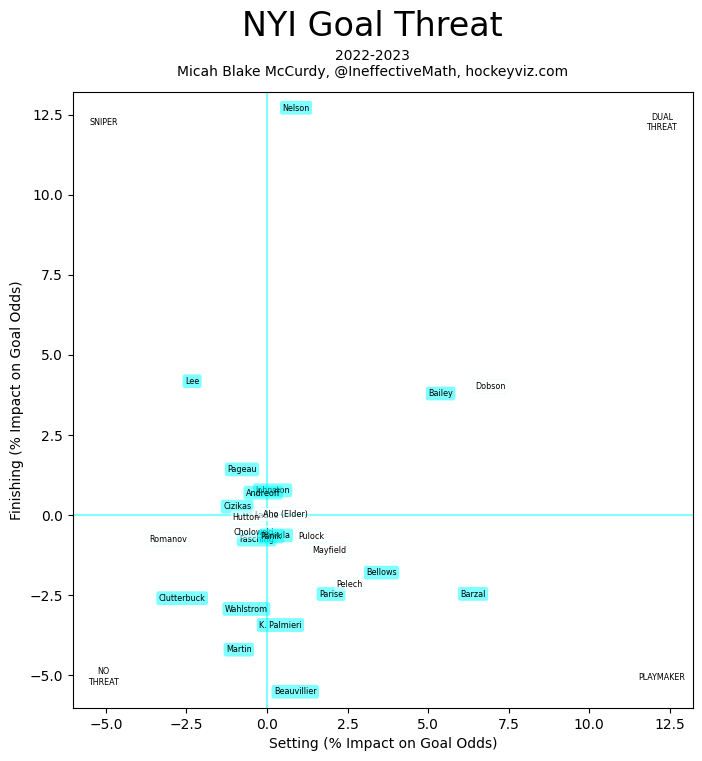
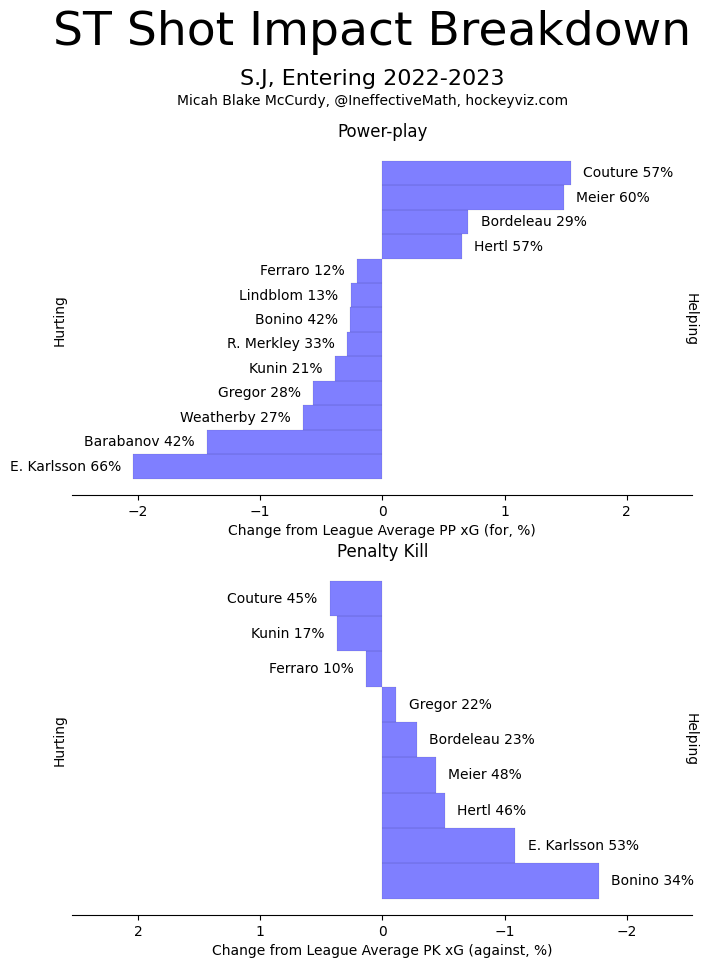
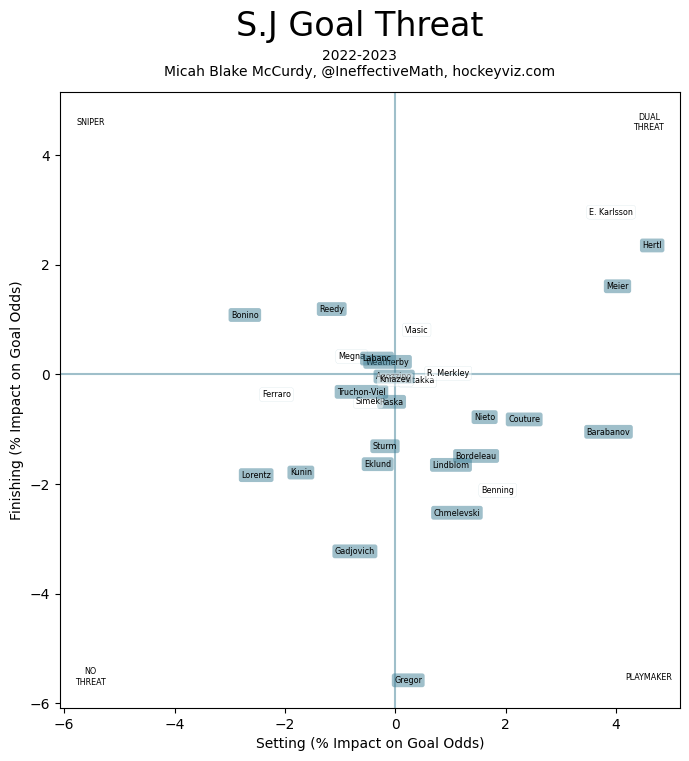
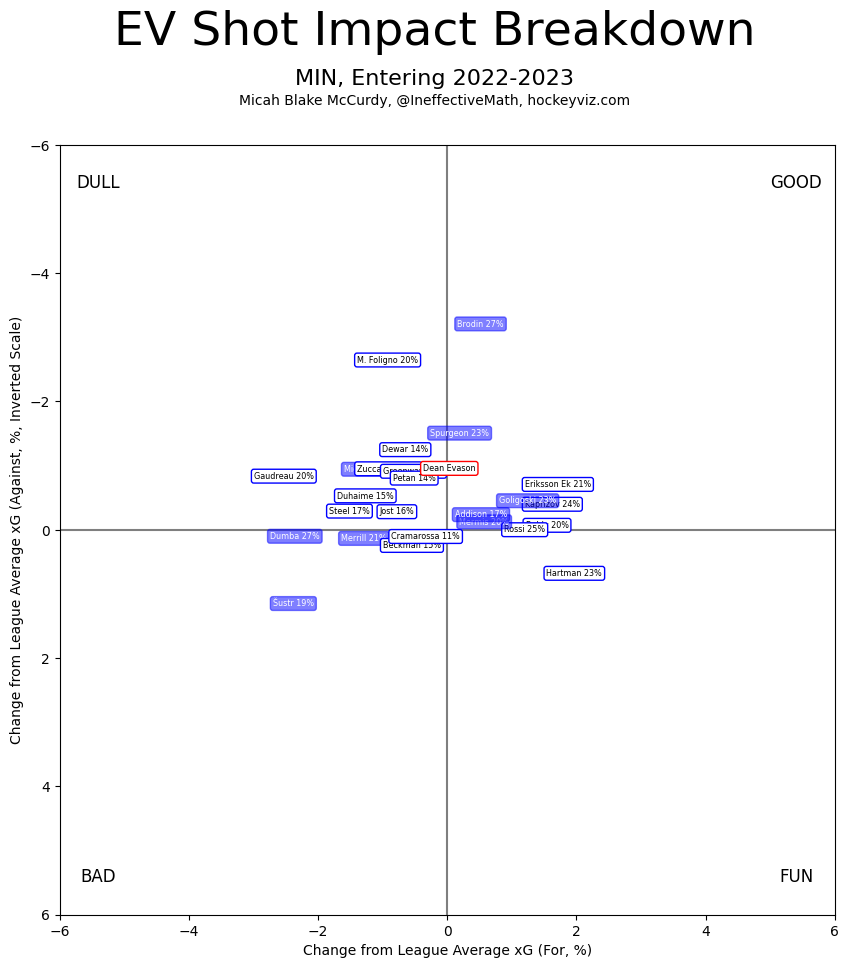
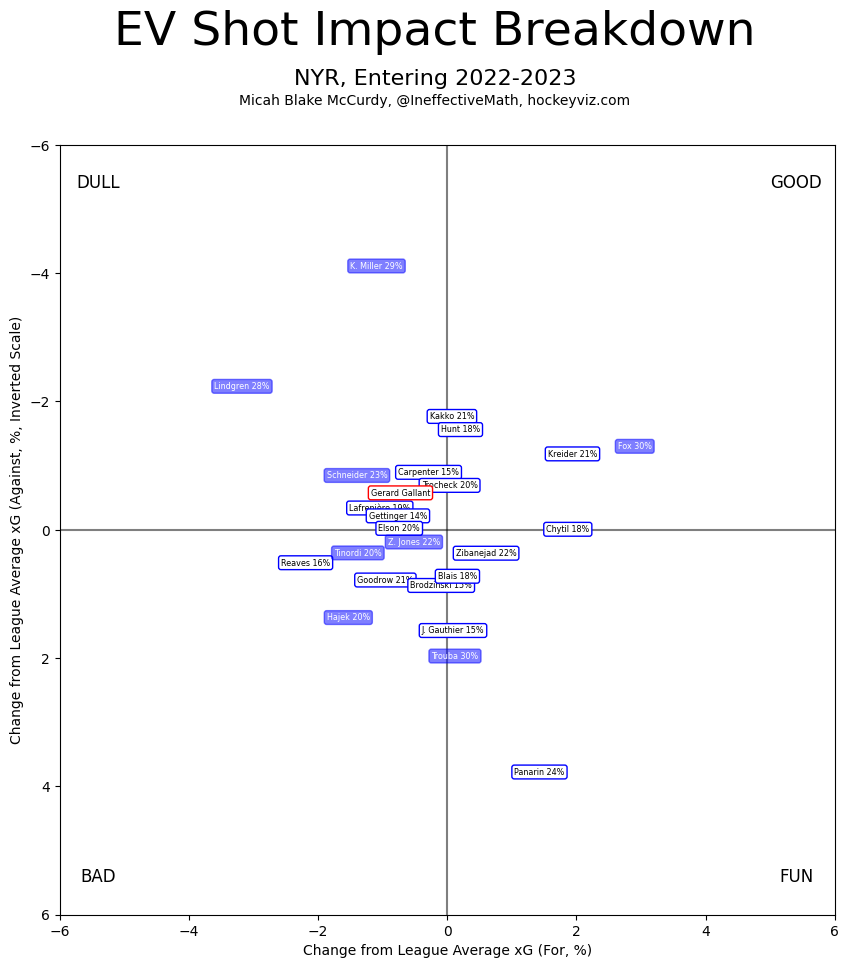
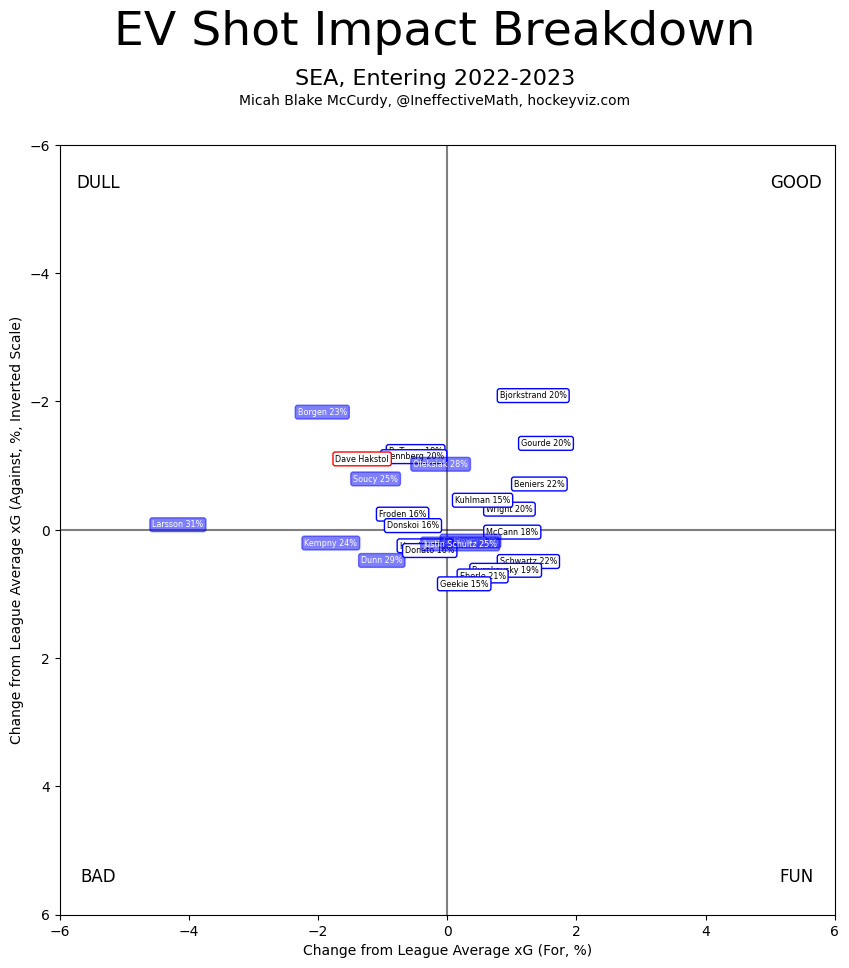
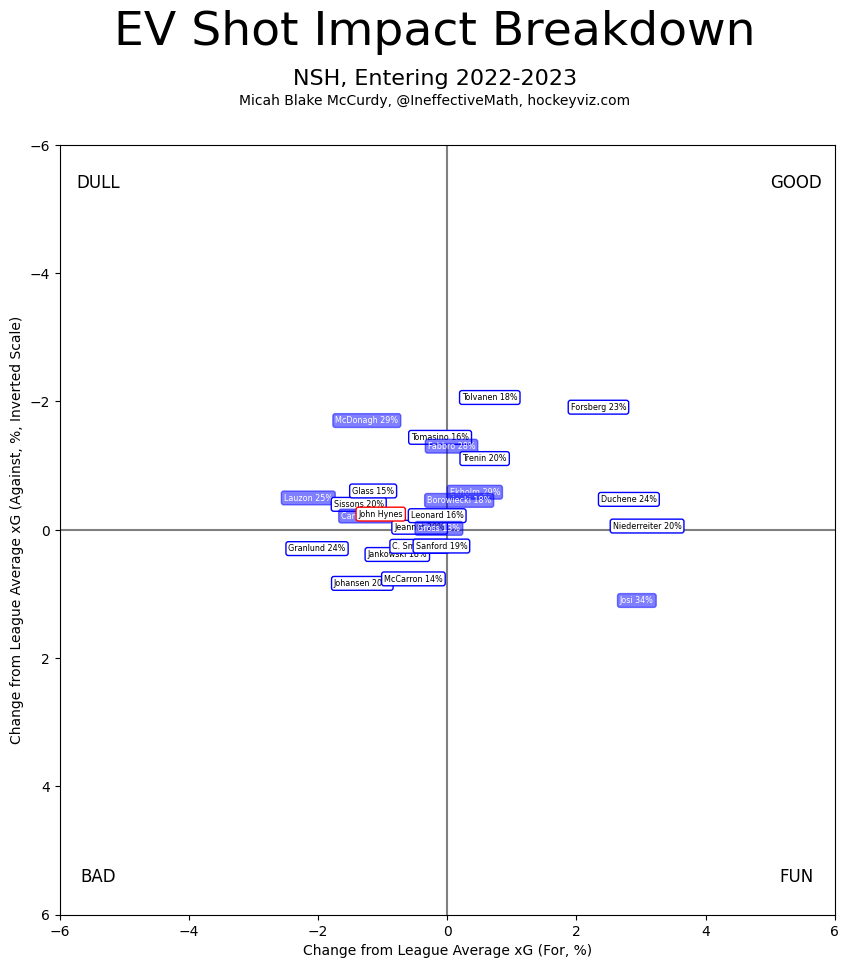
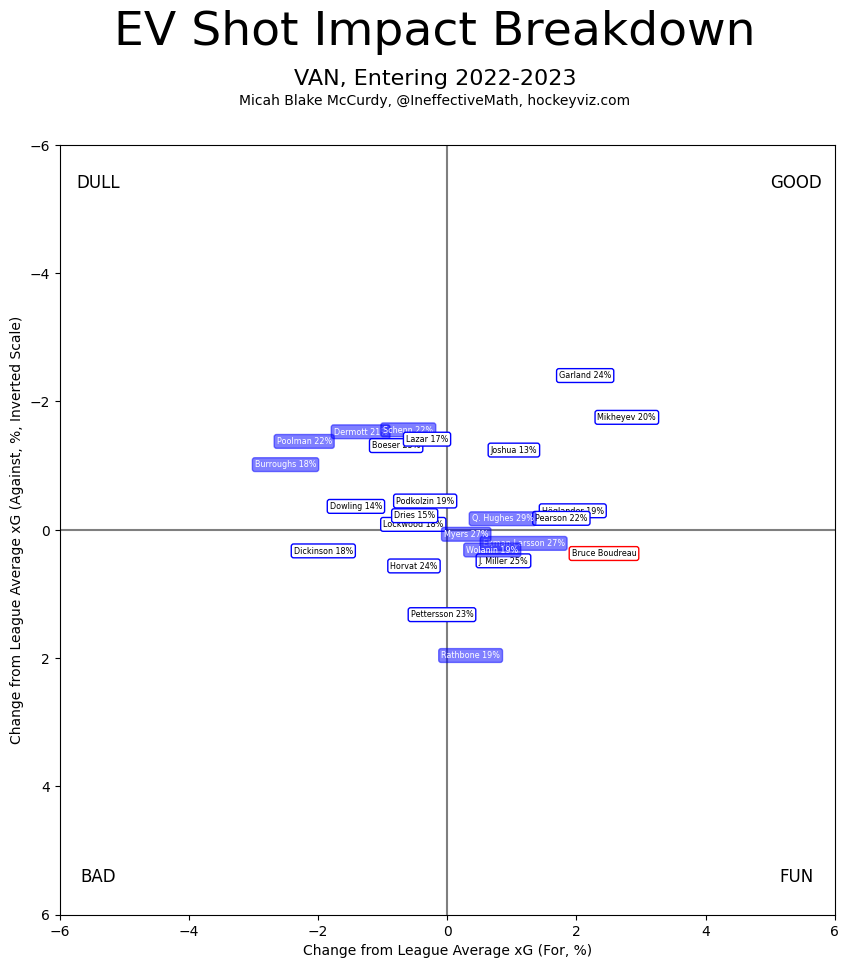
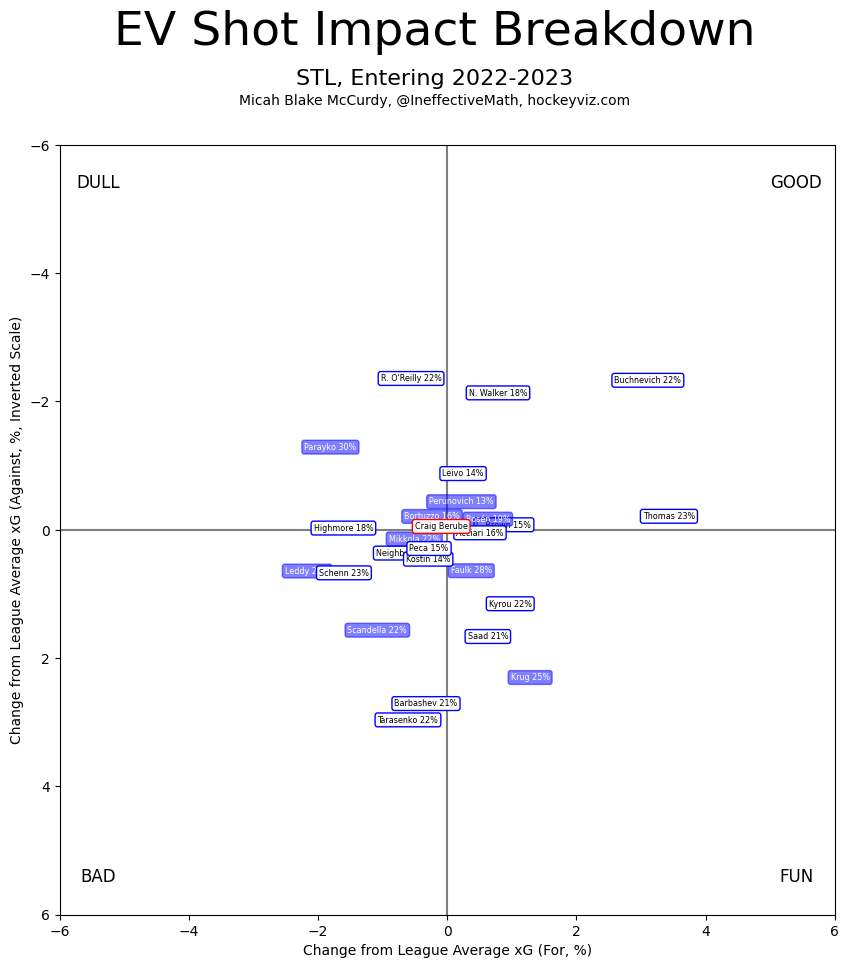
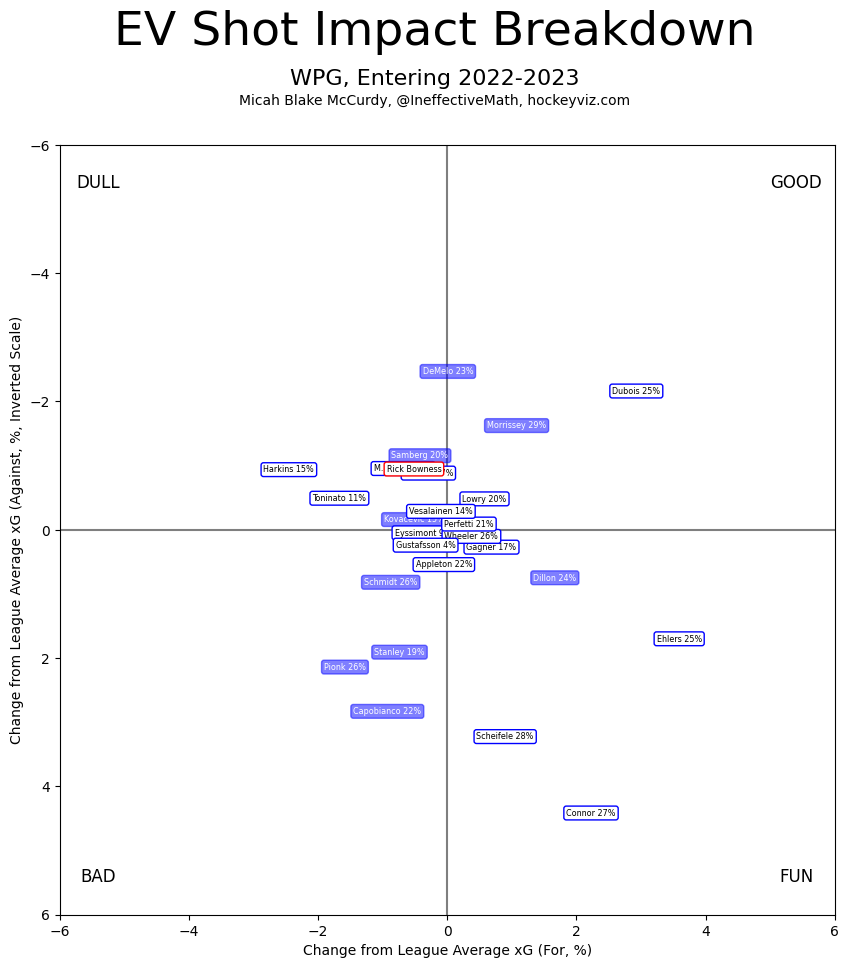
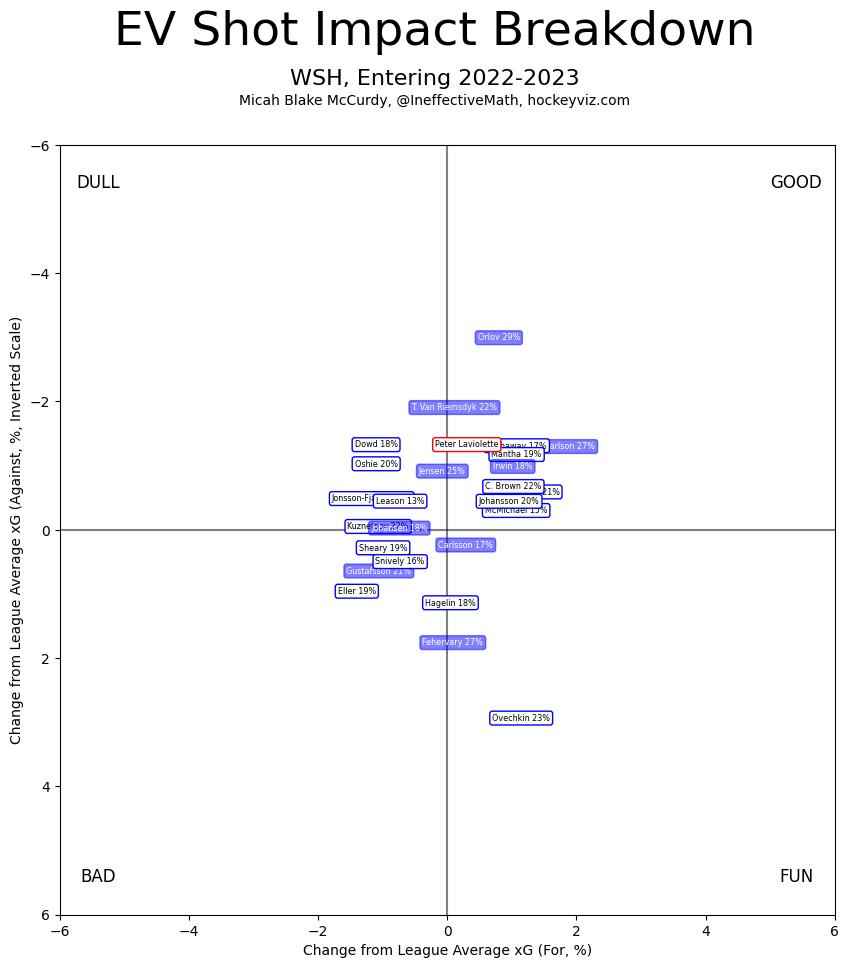
Using the isolated abilities of their players and their coach, I can form an estimate of how each team will perform "in a vaccuum", that is, before considering the schedule of games, which determines opponents and fatigue. As is my usual habit, positive values mean "more shots" or "more goals" as appropriate, and thus on offence red (more than average) is desirable and on defence blue (fewer than average) is desired. Similarly, positive shooting impact is better for shooters and negative impact is preferable for goaltending; the axis for the goaltending distributions is flipped so that "better" appears to the right for both shooting and goaltending.


Stat Breakdowns
Using the above, I can make some summary graphics for the league as a whole.

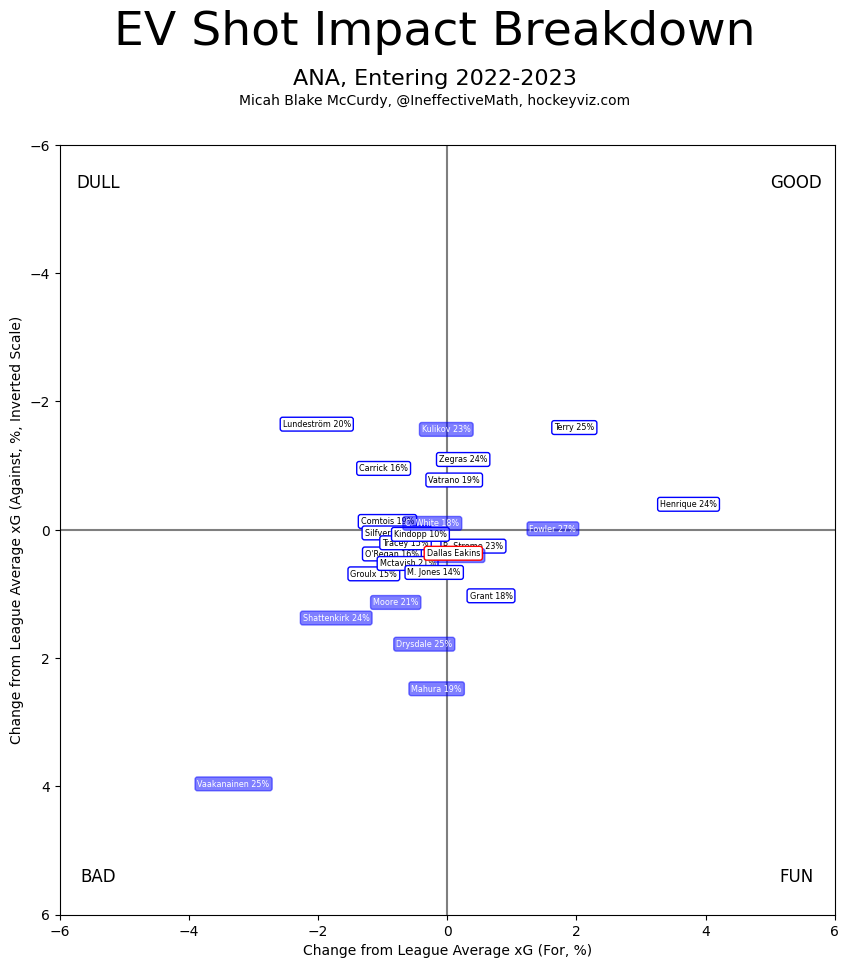
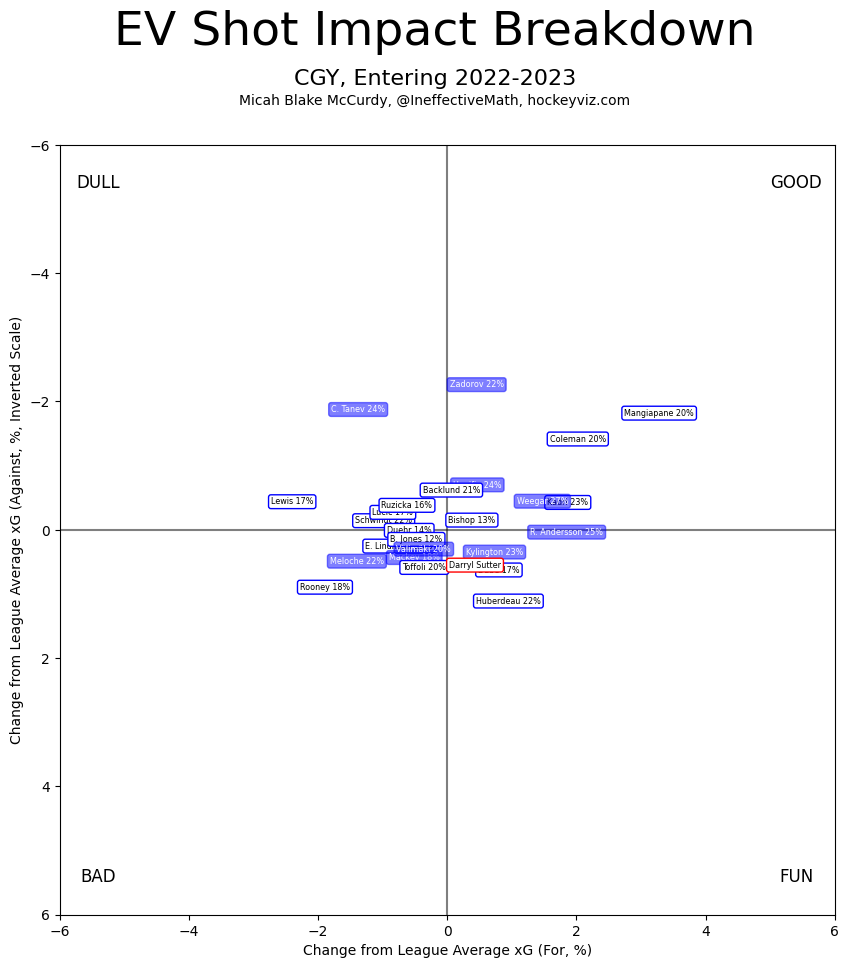
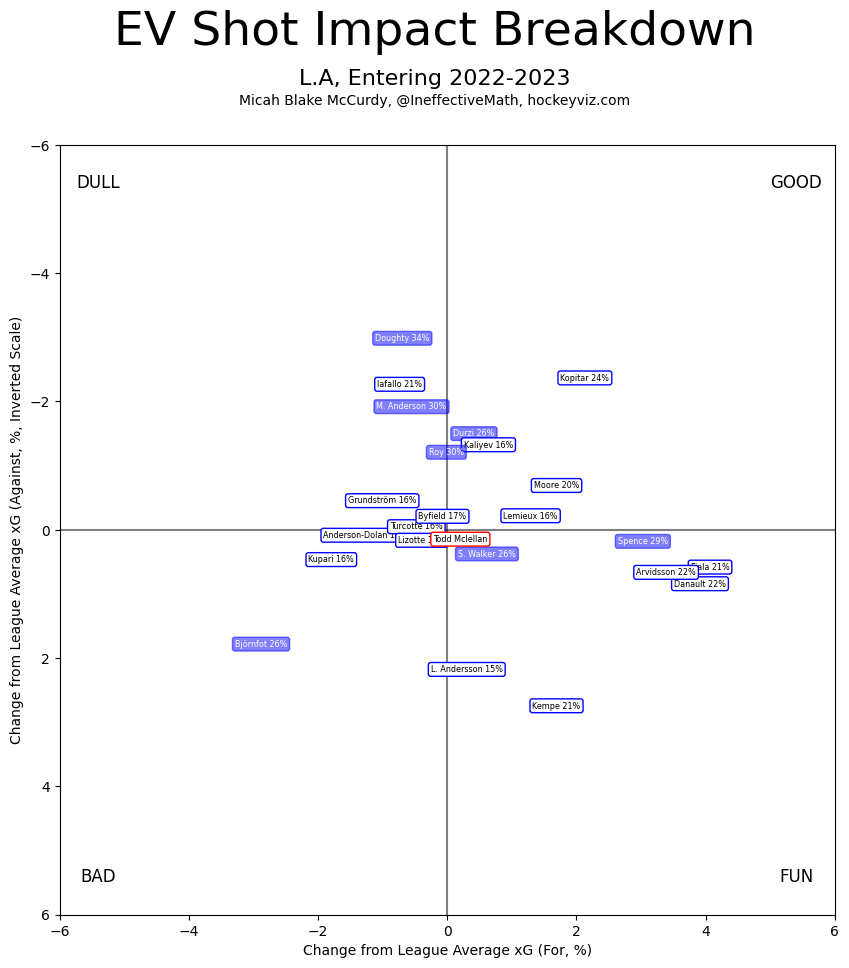
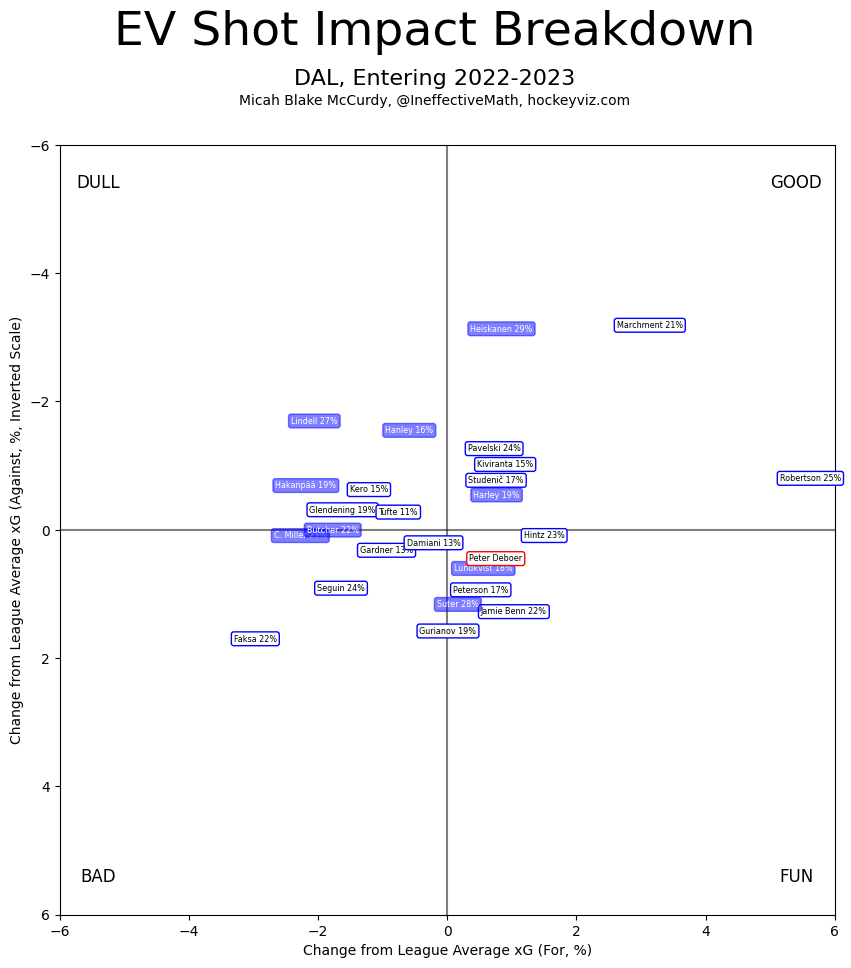
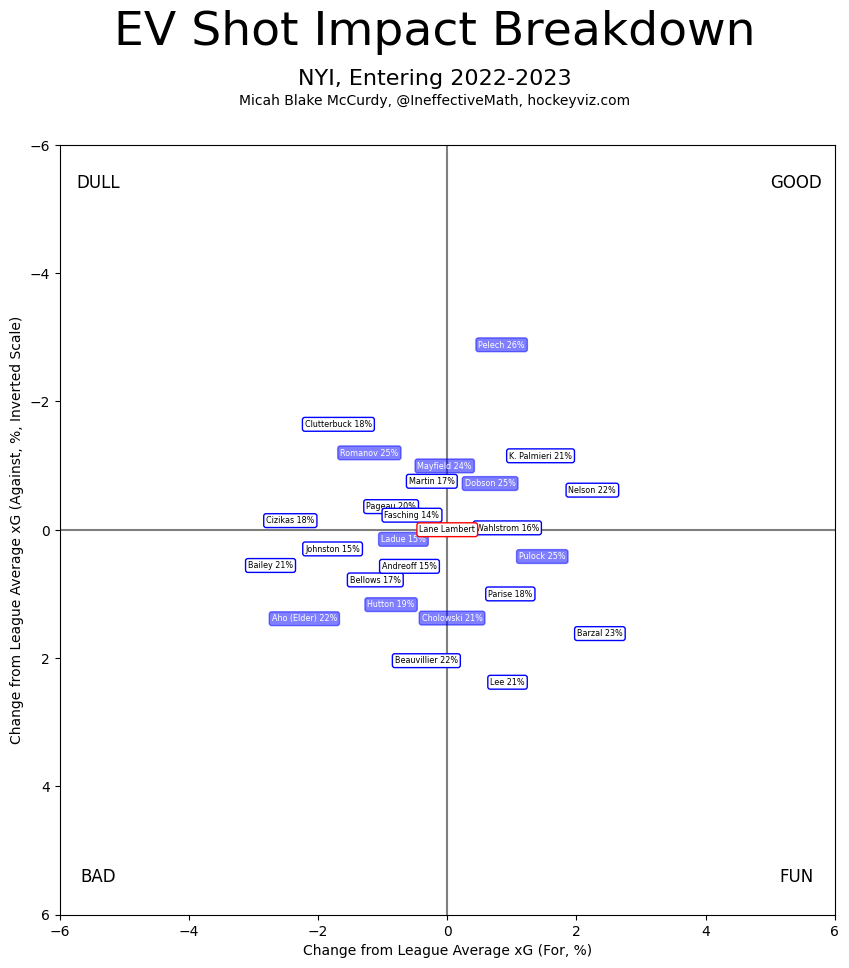
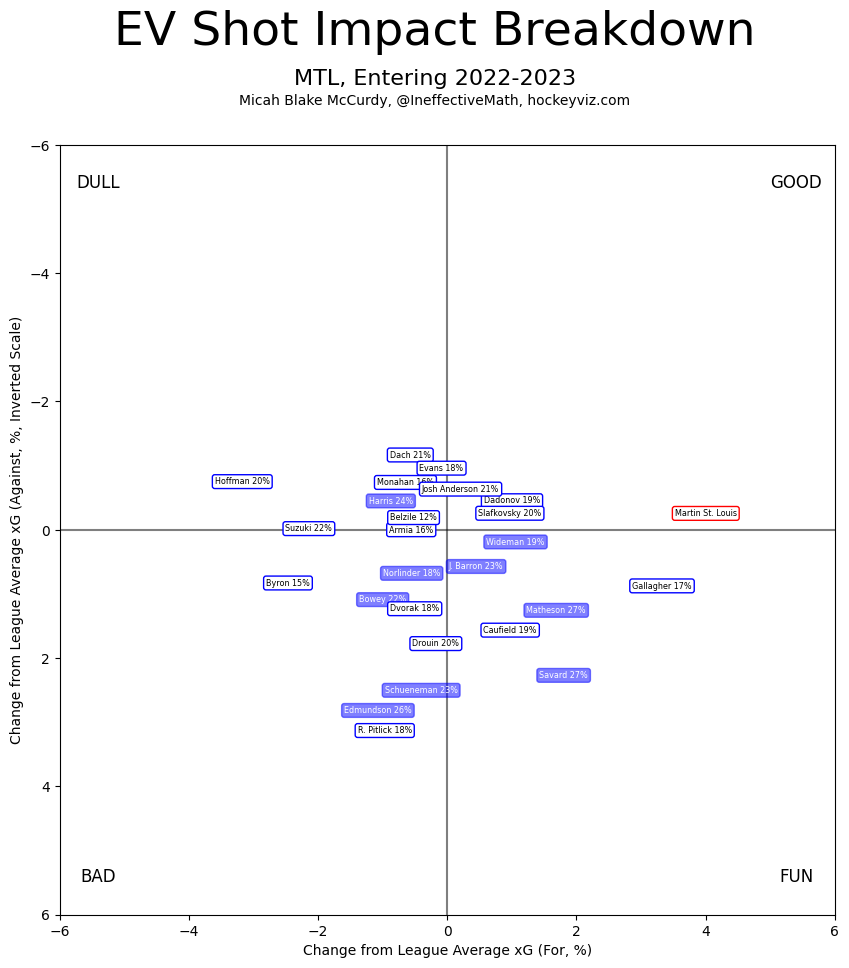
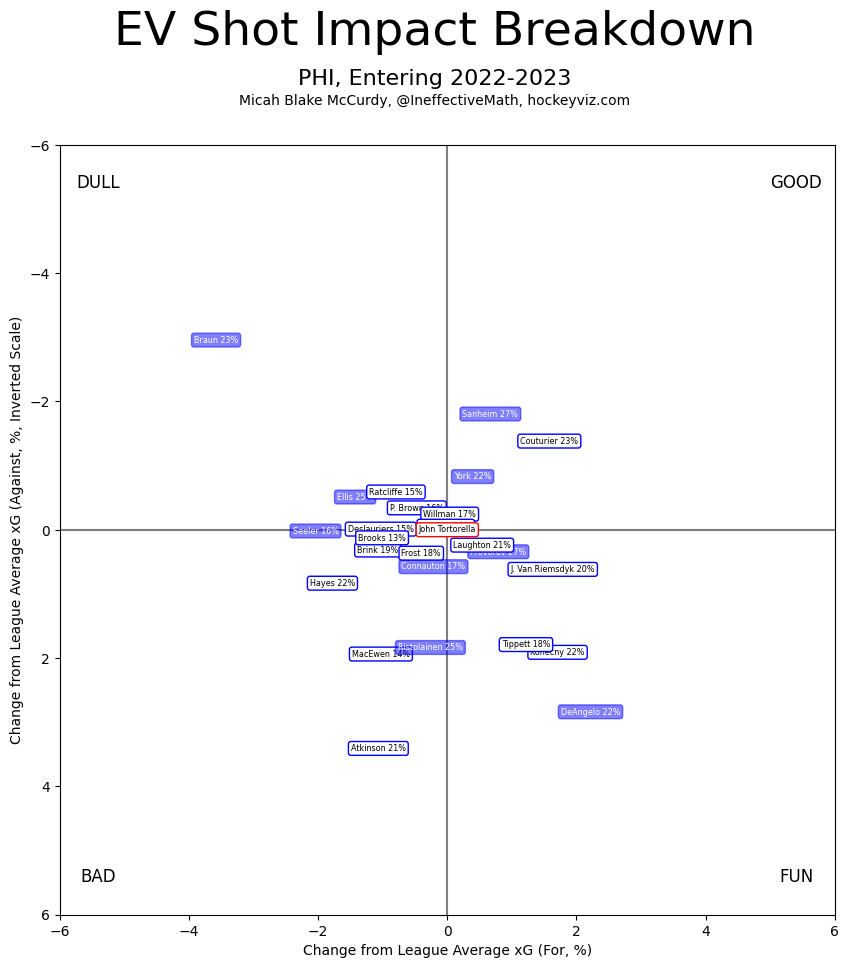
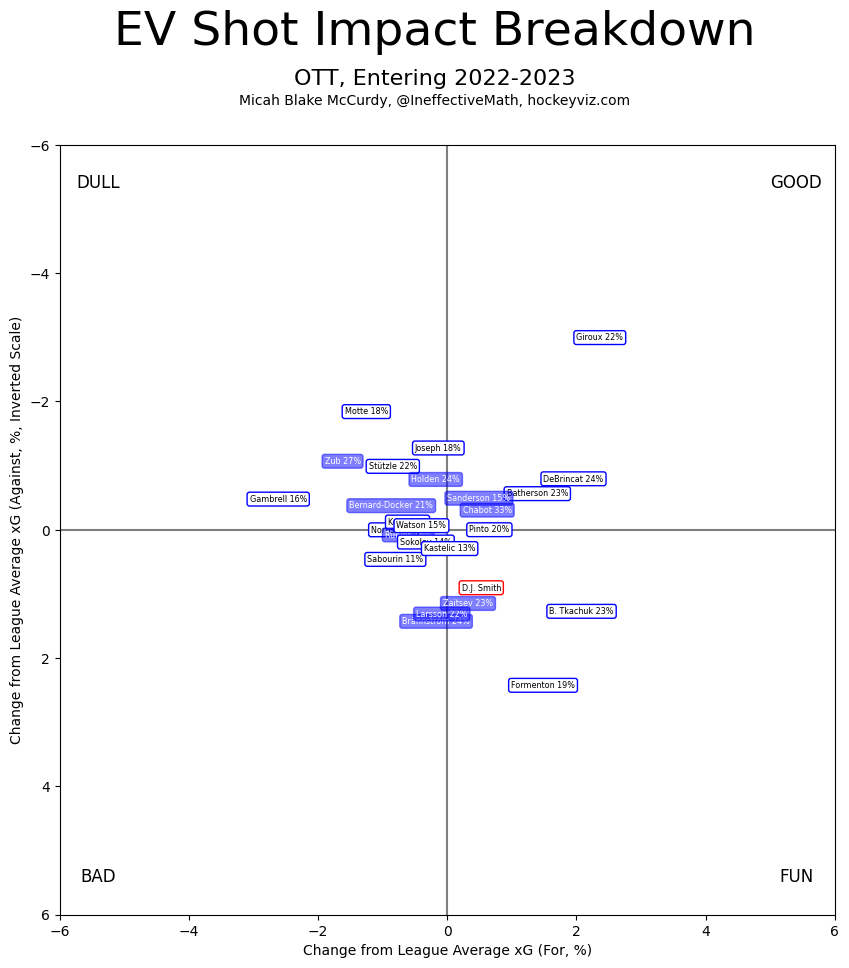
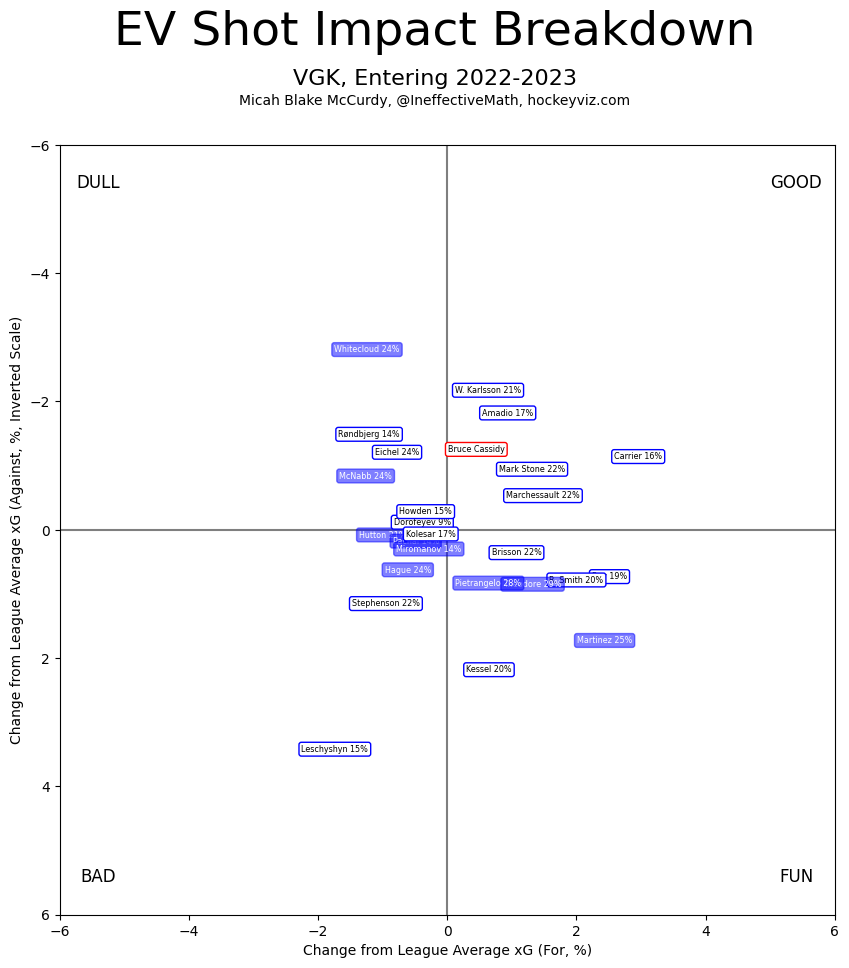
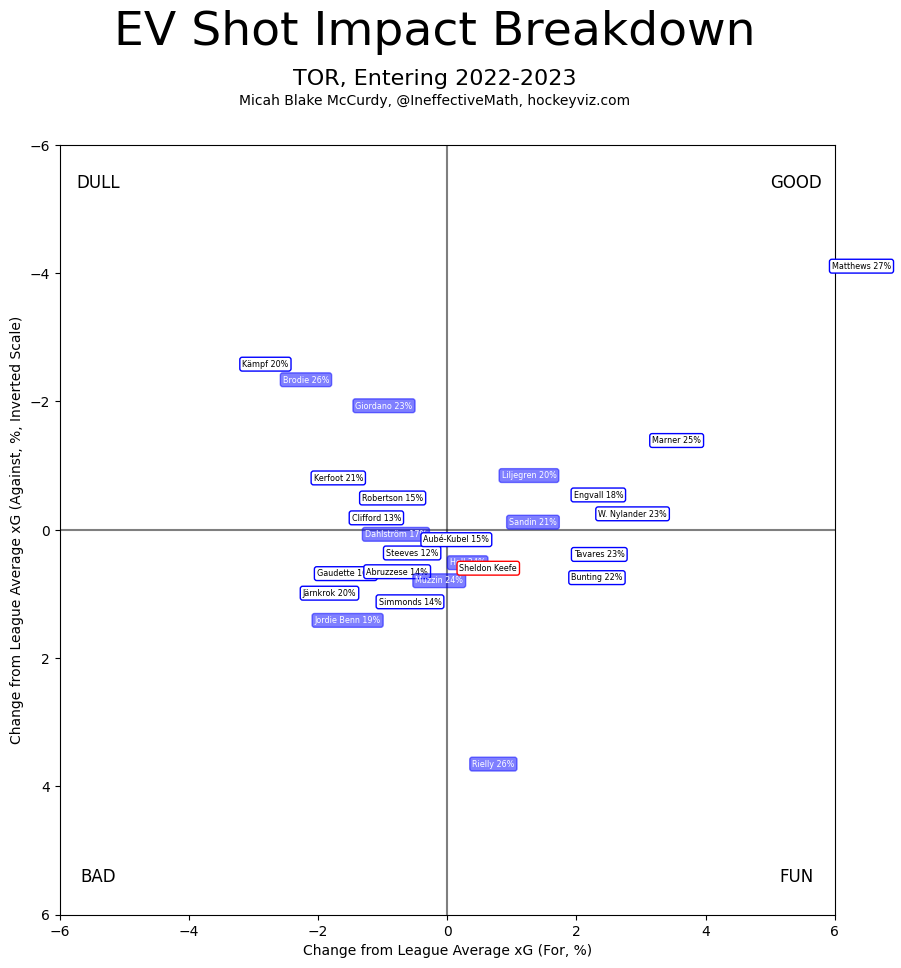
Even Strength Shot Rates
The most basic result in the sport is the shot. To win a team will shoot often and from dangerous locations and with some measure of finishing skill. First, we look at even-strength shot rates, taking into account the shot's type and location. This gives an idea of "total offence" or "total defence", before we consider finishing talent and goaltending talent. I call this estimate expected goals, or xG for short. The zero point is set to what we saw in 2021-2022, of around 2.6 goals per hour of 5v5 play. If the league opens up, it's possible for this year's average to be above zero (or below zero if the league becomes more defensive). The "NHL" button indicates the average of the team rosters as constructed currently. Before taking any possible injuries into account, I expect the league will be slightly tighter than last season.
The better offensive teams are further to the right, the stronger defensive teams are near the top. The best two-way teams (at five-on-five) are in the top corner. At this foundational stat there are four clear worst teams, on a sliding scale between weak offensively (Chicago, Arizona) and weak defensively (Columbus, Montreal).
Notice also that, at the team level, there are no "fun" teams; that is, no teams who employ a roster of skaters designed to trade chances. This is a tactical weakness of the league as a whole.

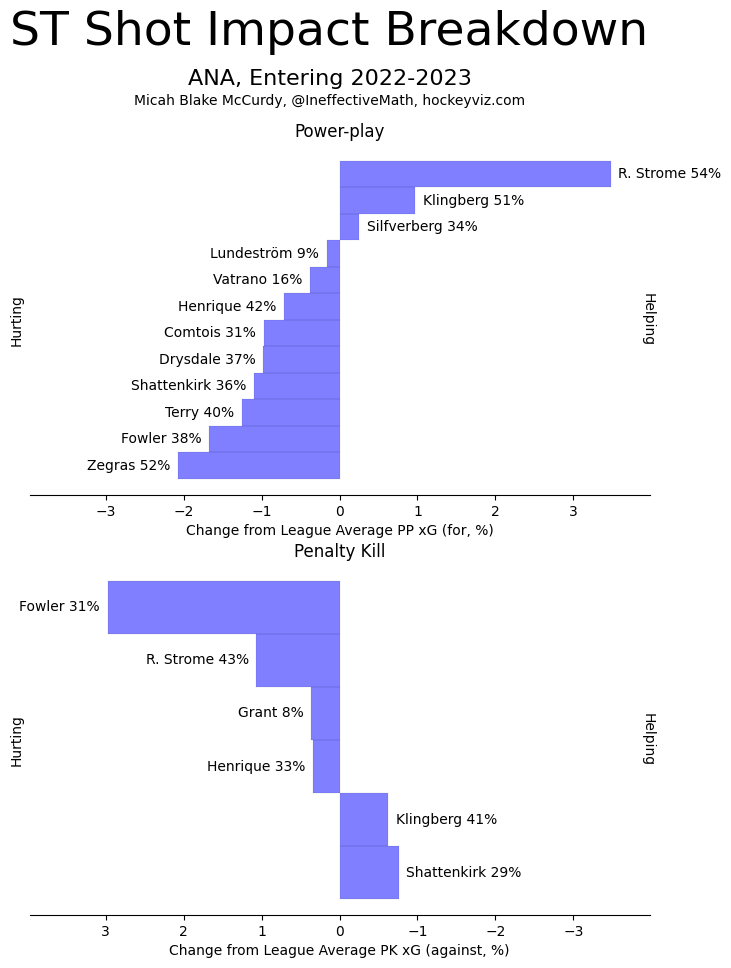
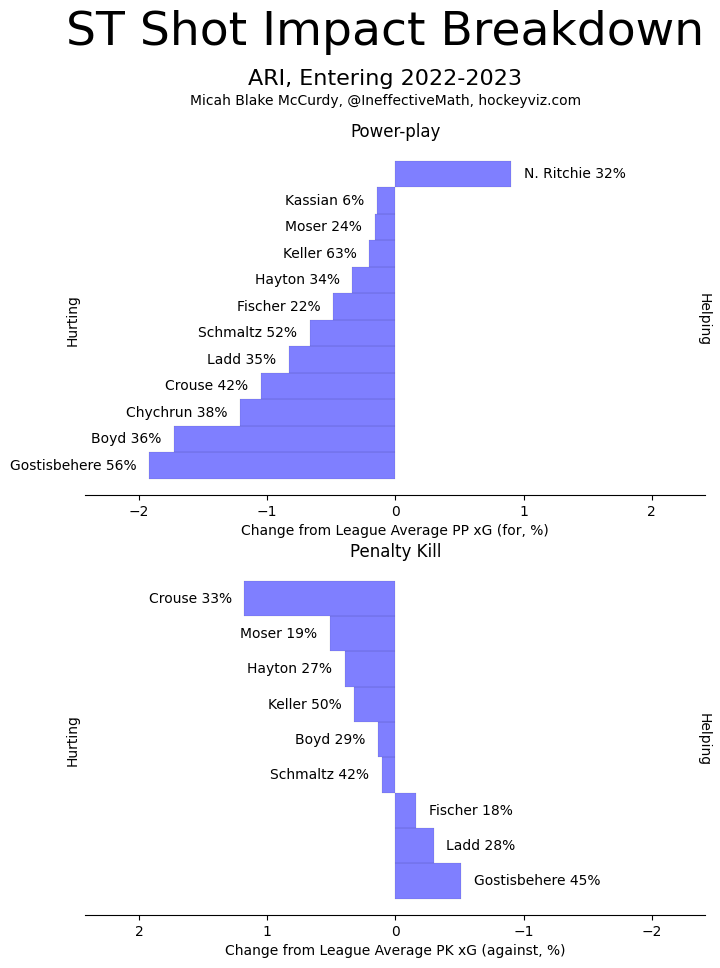
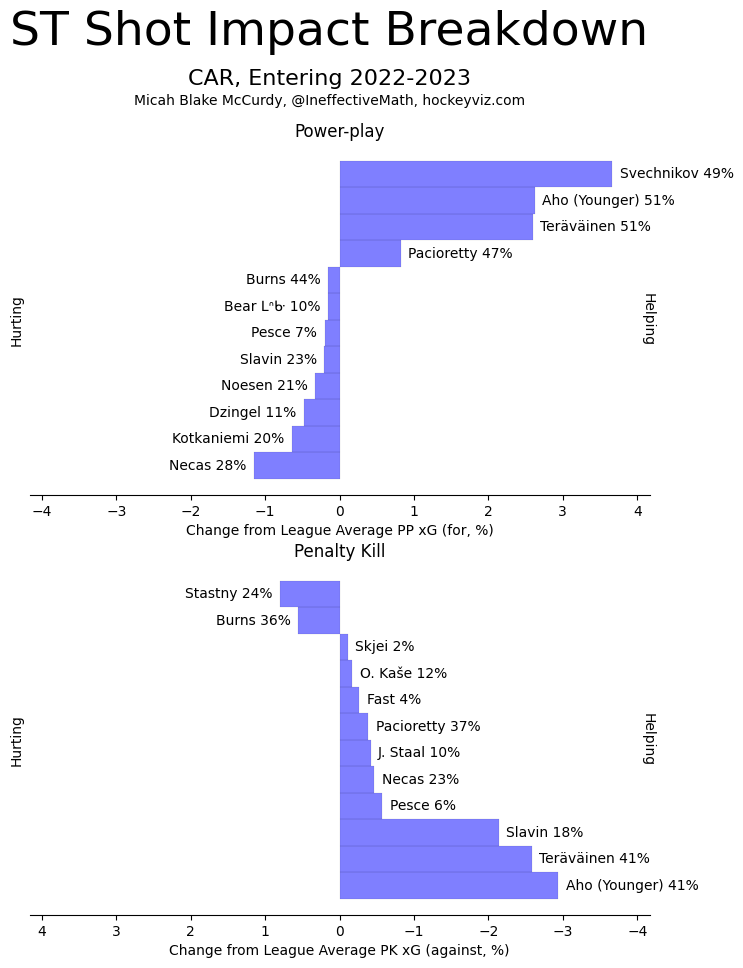
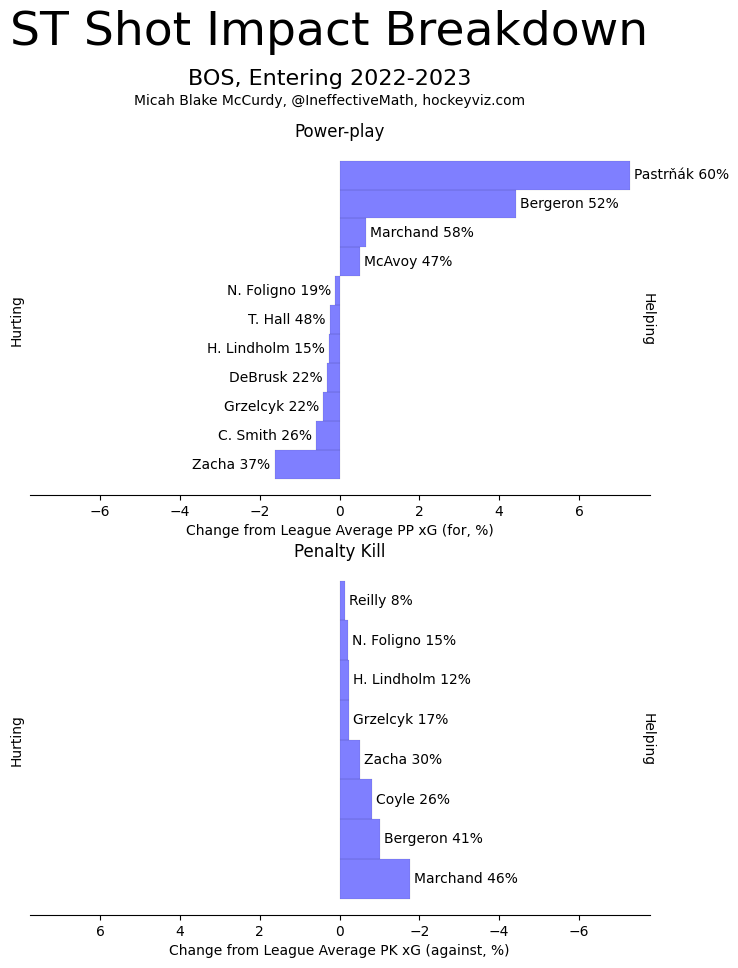
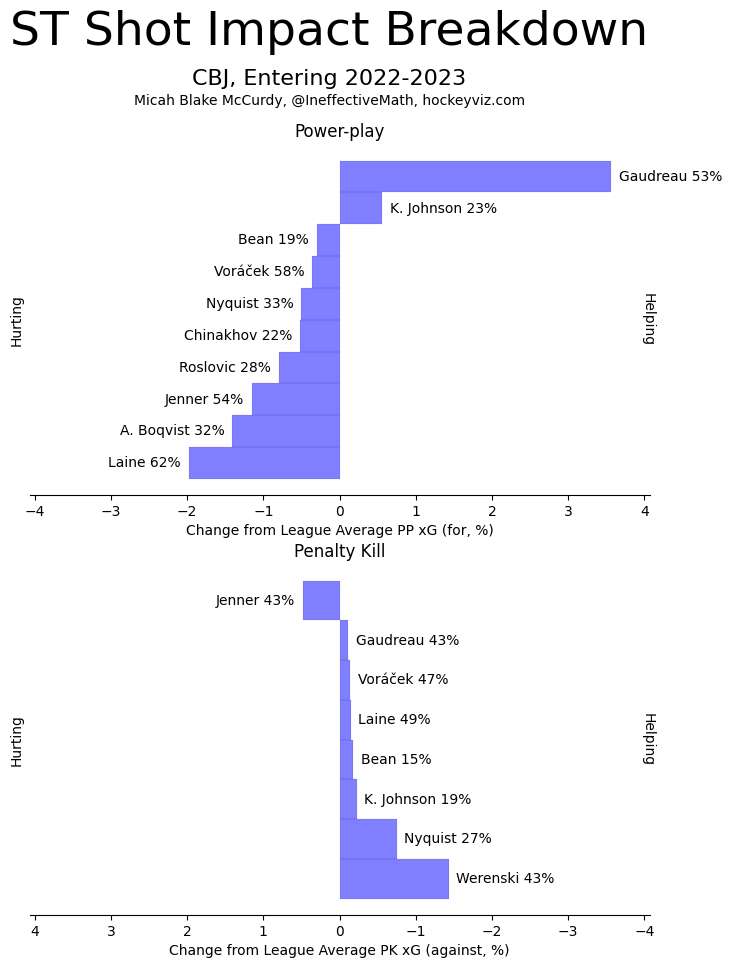
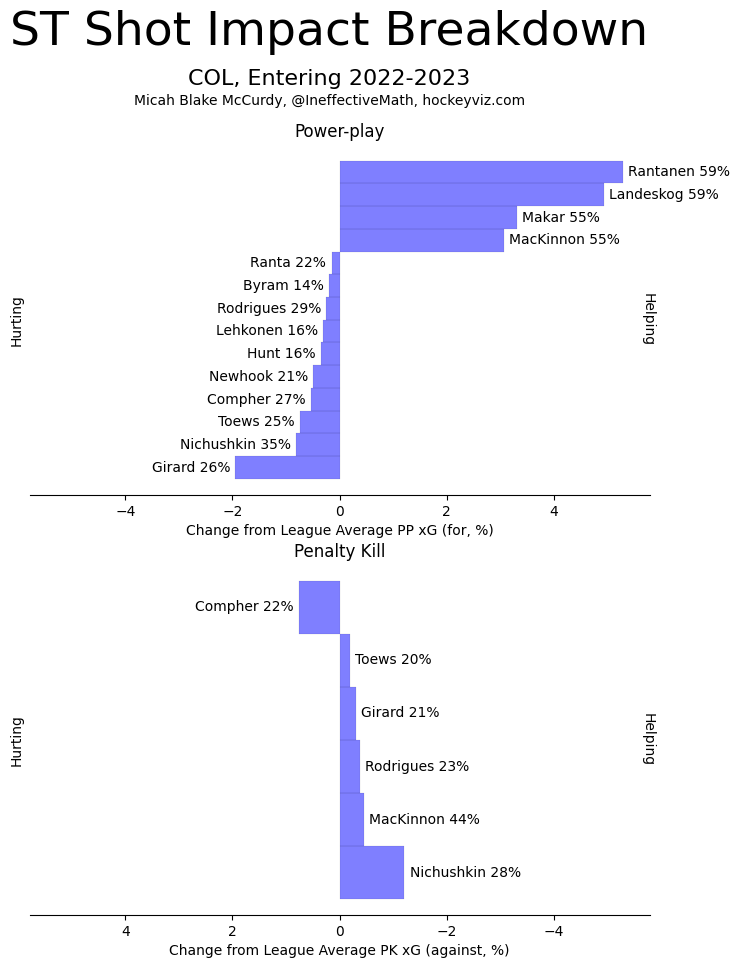
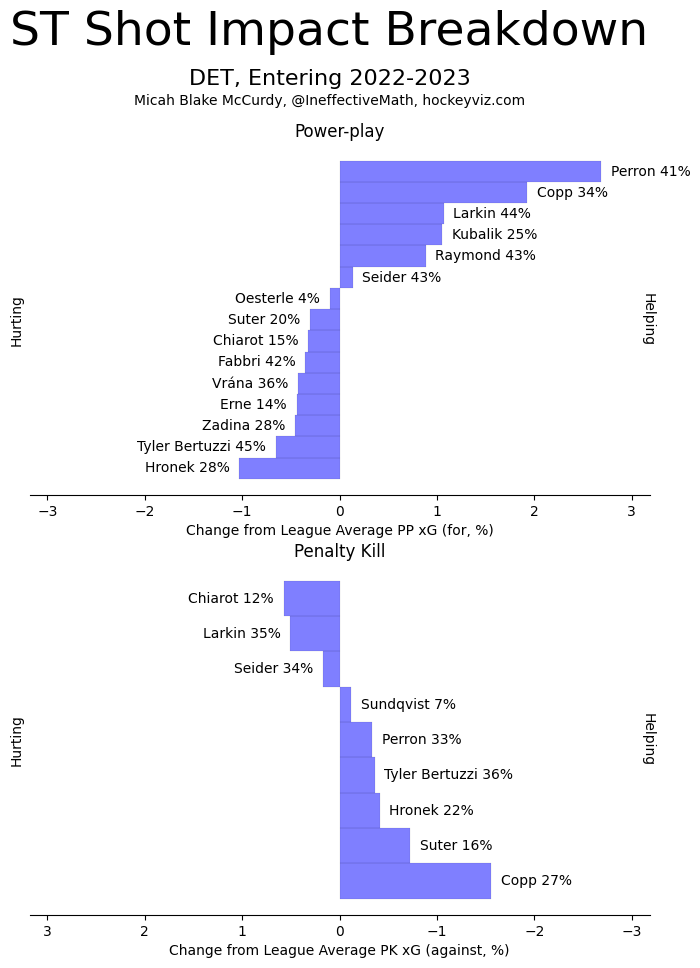
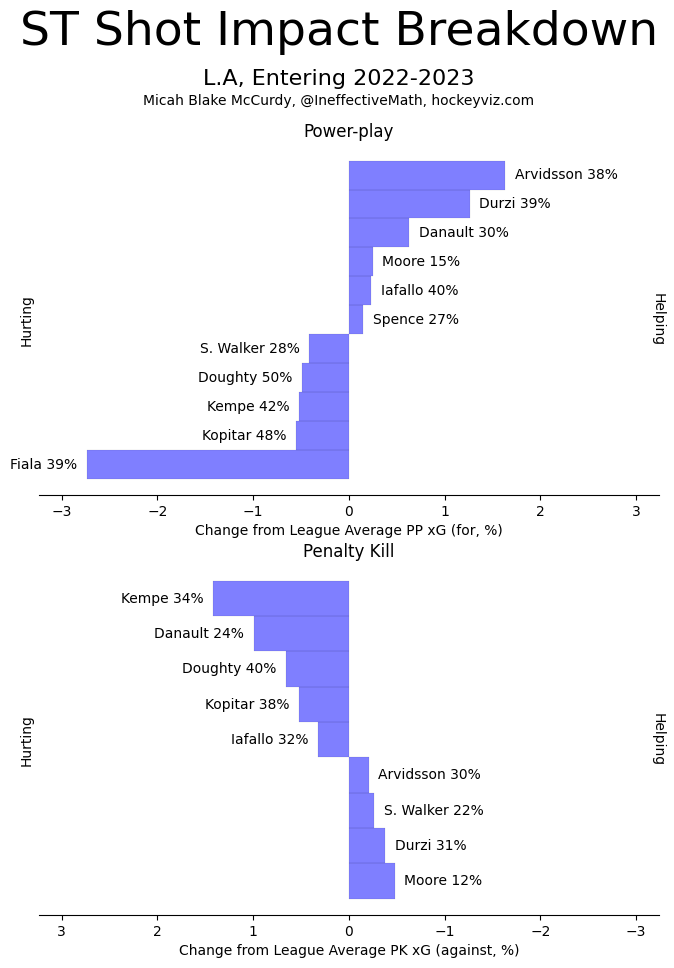
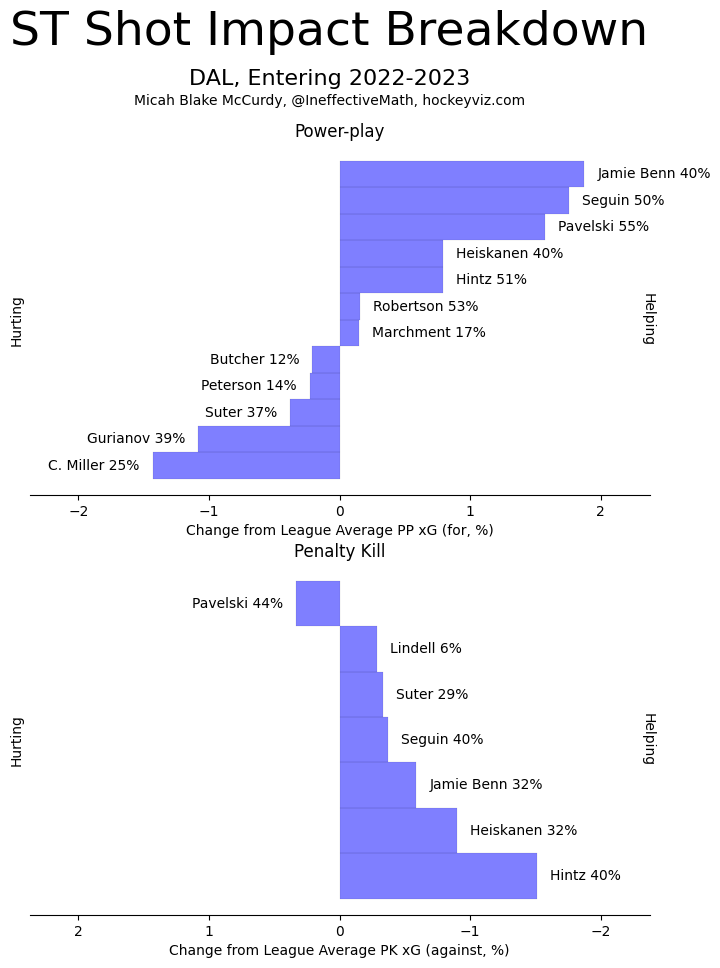
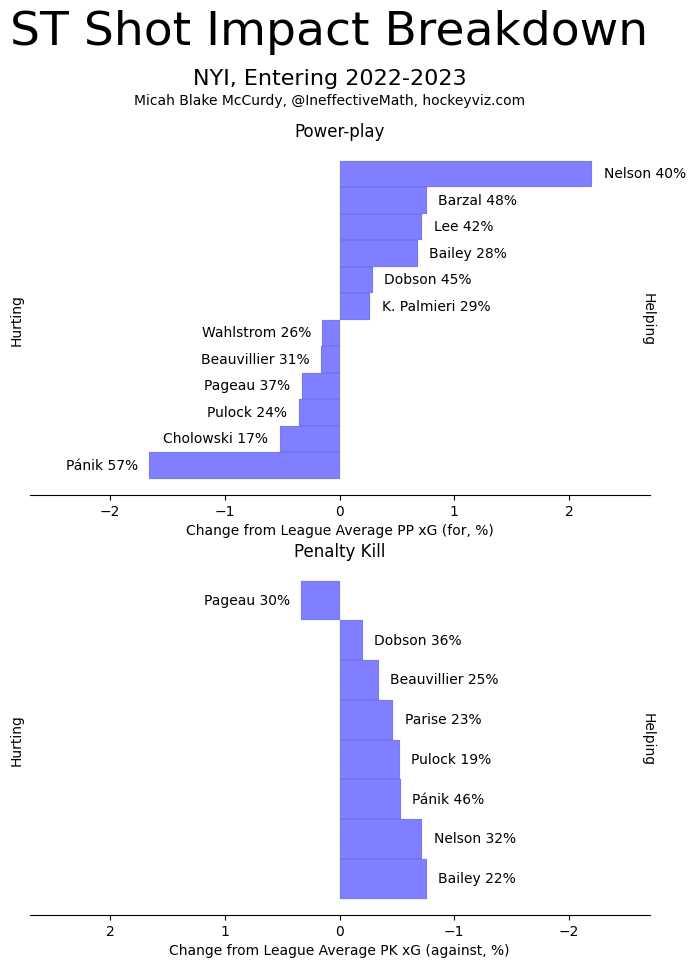
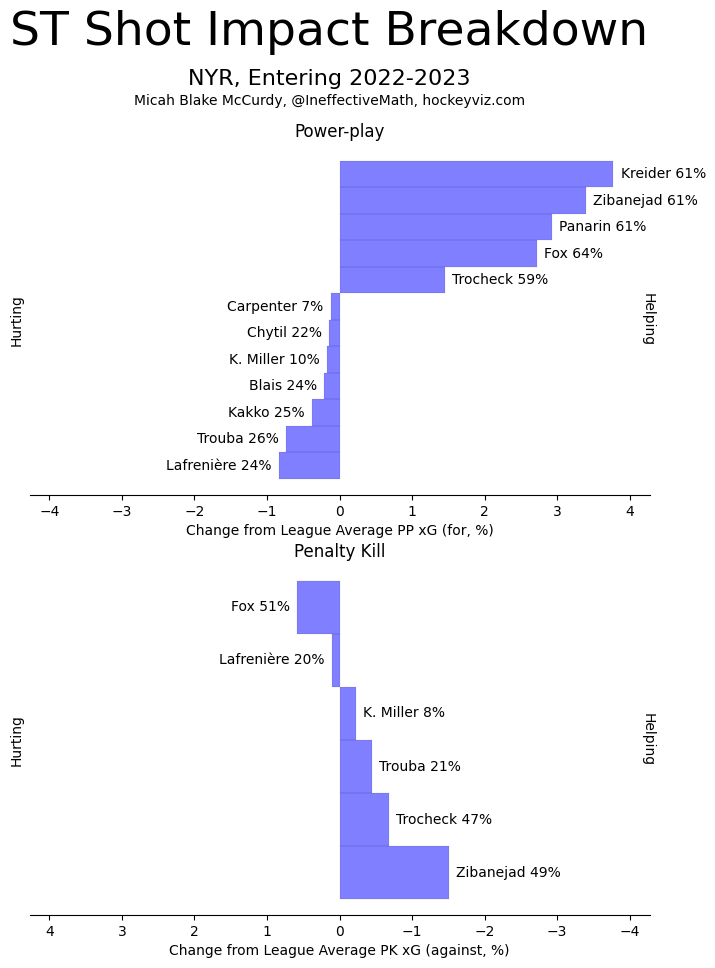
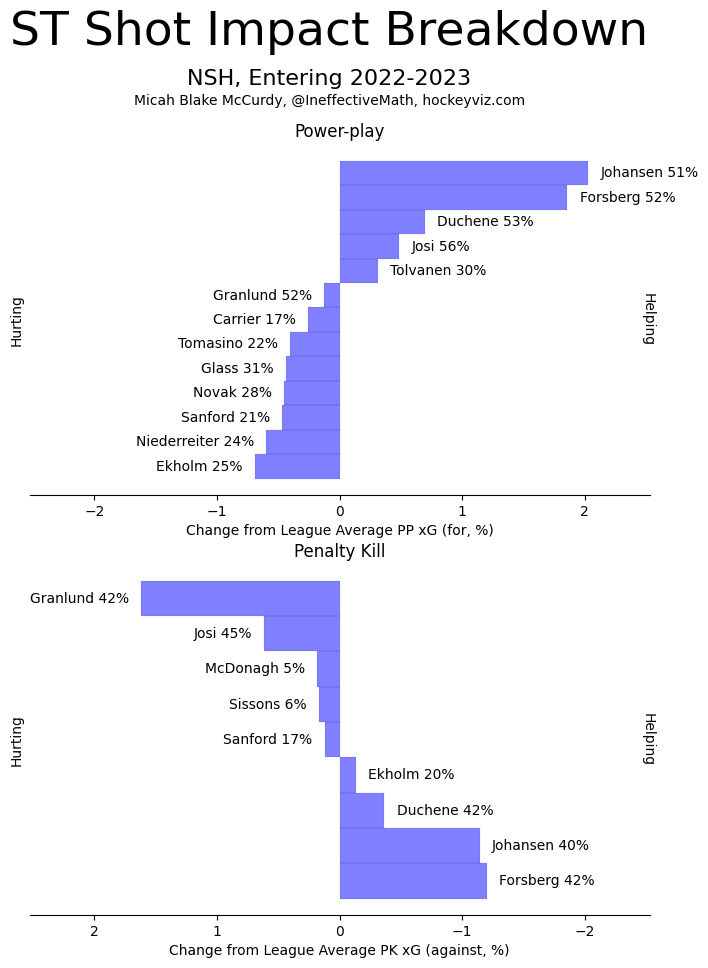
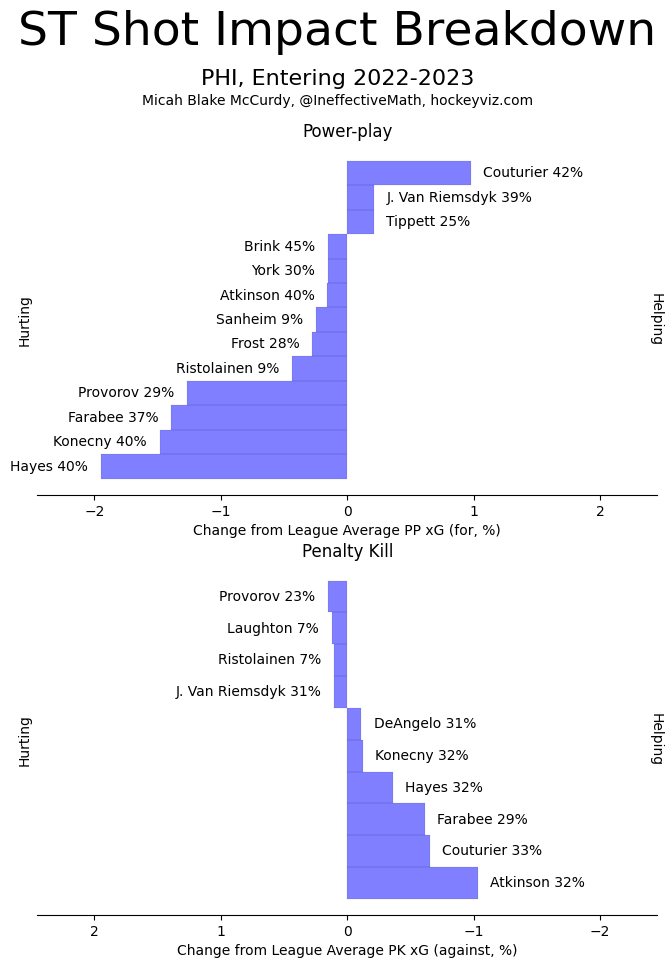
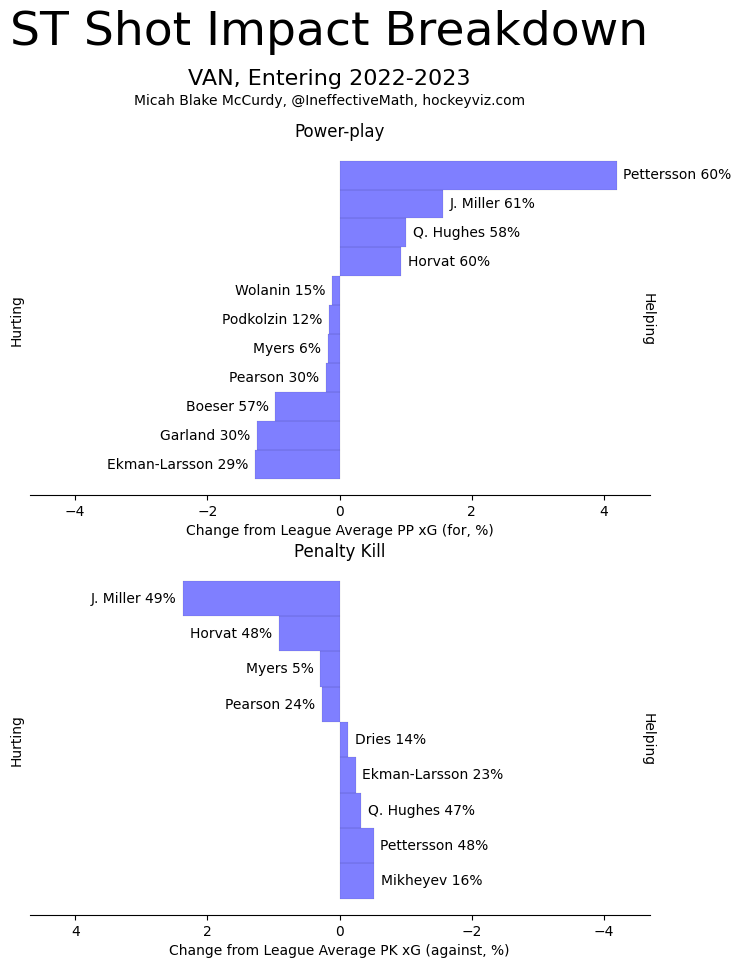
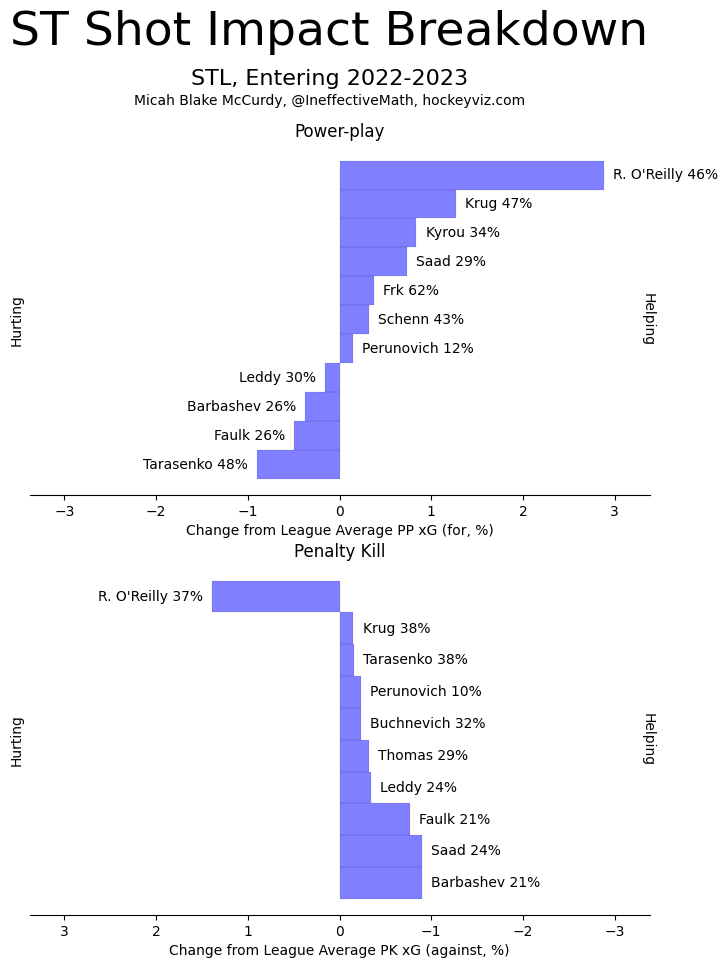
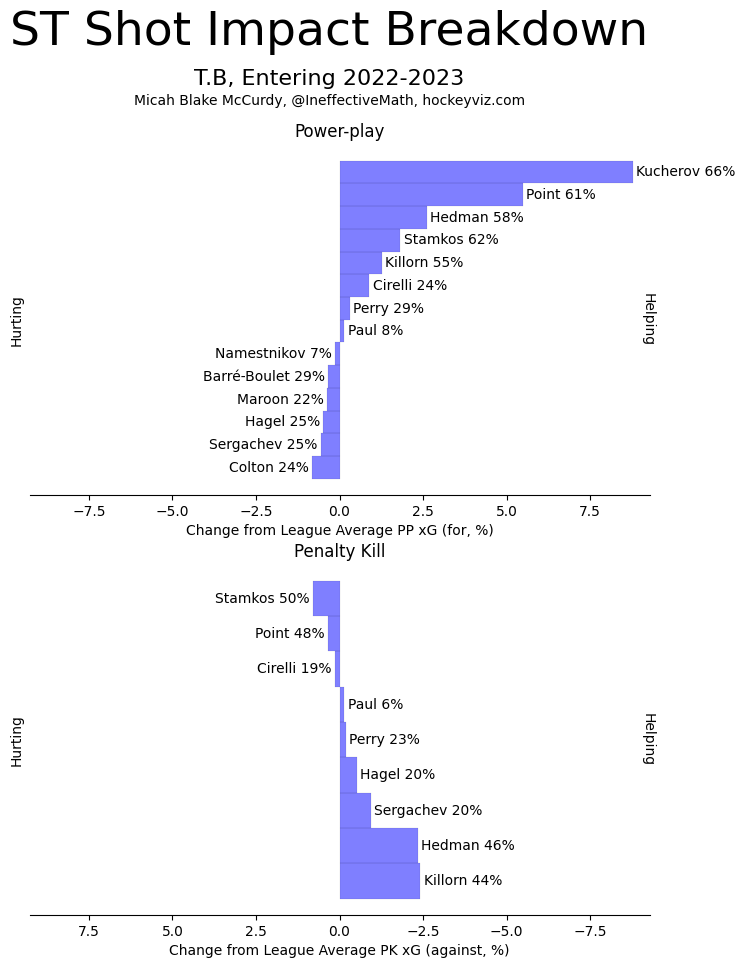
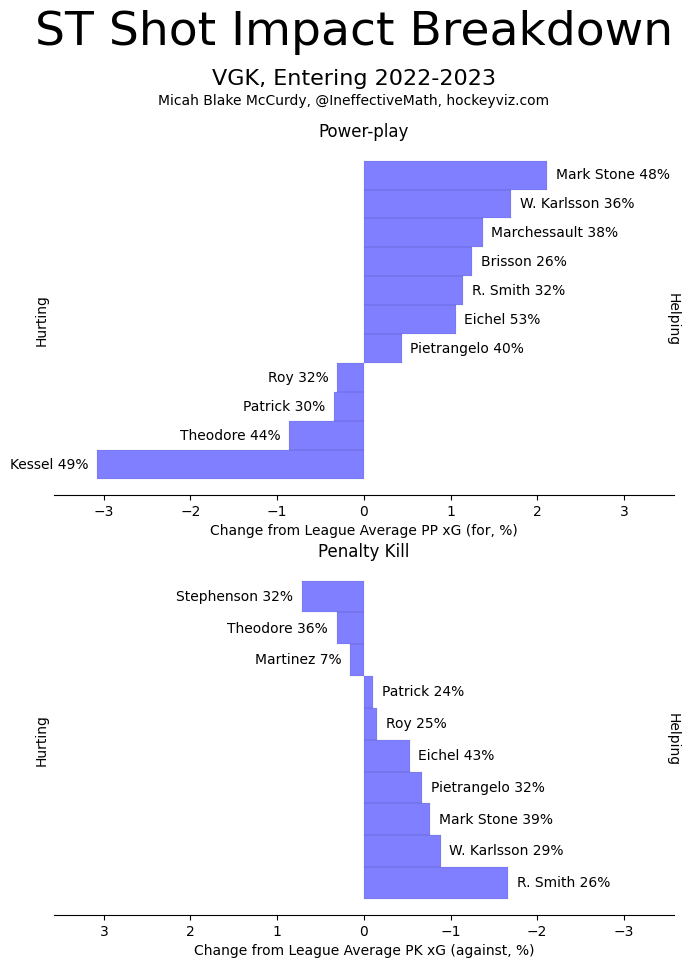
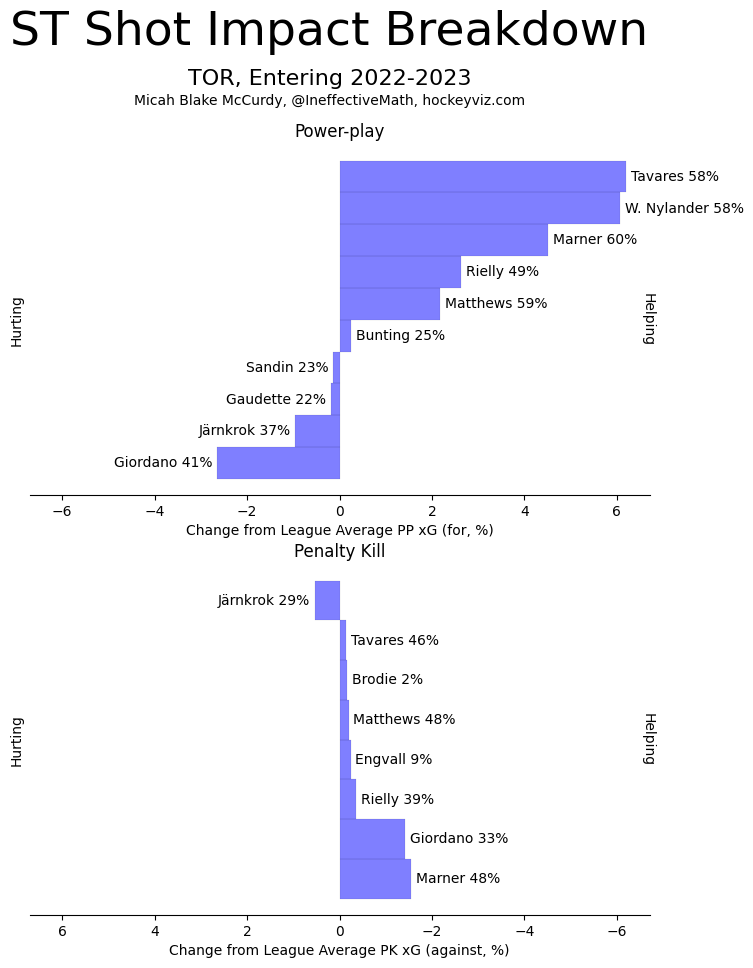
Special Teams Shot Rates
The same measurement above, but for special teams: power-play offence on the x-axis, and penalty-kill defence on the y-axis. Power-play defence and penalty-kill offence are not considered here.
This season (like last season) most of the extreme values are strengths—the Oilers will have an exceptionally strong chance generation on the power-play; the Hurricanes a very strong penalty-kill.
The overall distribution of talent in power-play ability is a fair bit larger than the distribution of penalty-kills.
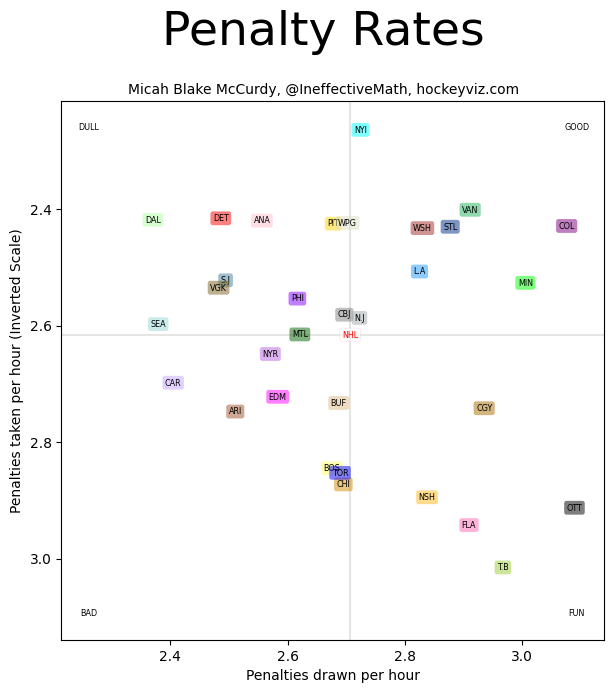
Penalties
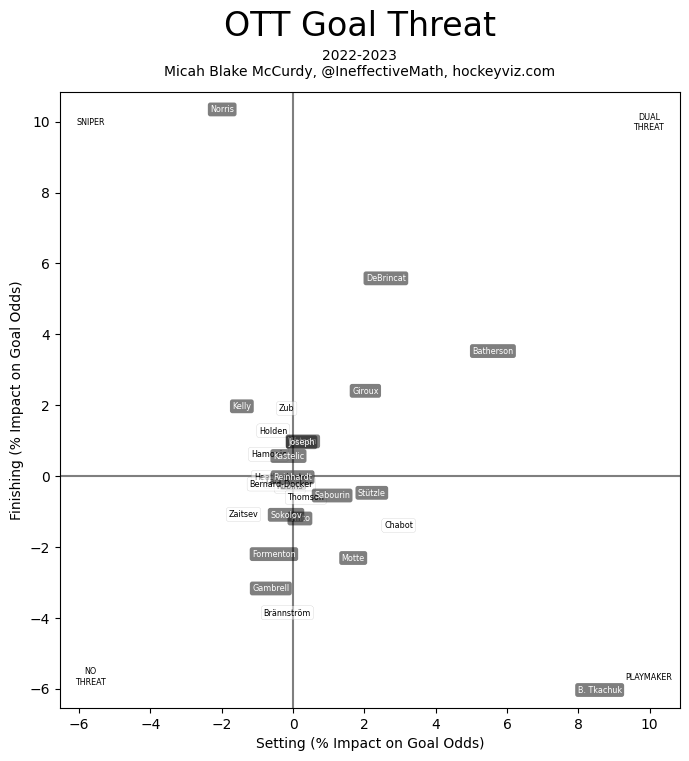
Expected penalty differentials for teams are computed from expected icetimes for each player, multiplied by individual tendencies to cause their team to take or draw penalties, not merely individual rates. Among other things the Senators' strong penalty-drawing ability meshes well with their very strong power-play chance generation.
The total magnitude of the pair of distributions is not very wide; the strongest team (Colorado) playing the weakest team (Carolina) can expect to obtain, on average, about one extra power-play in a typical game.
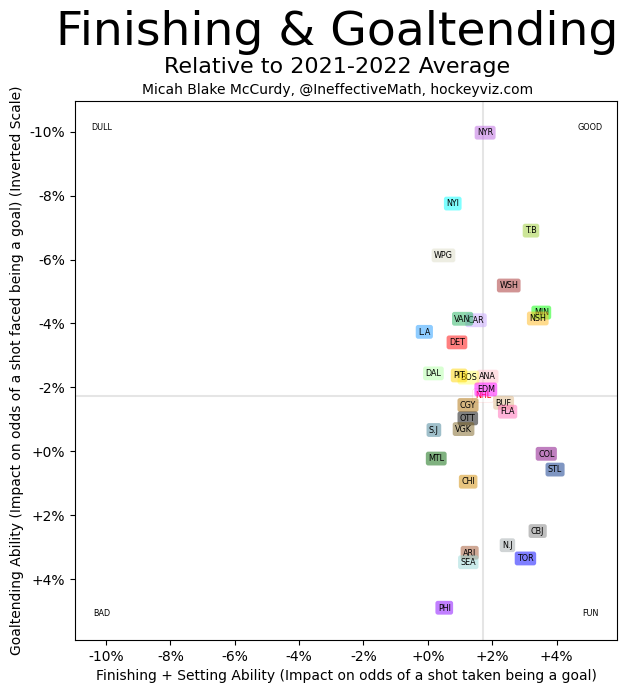
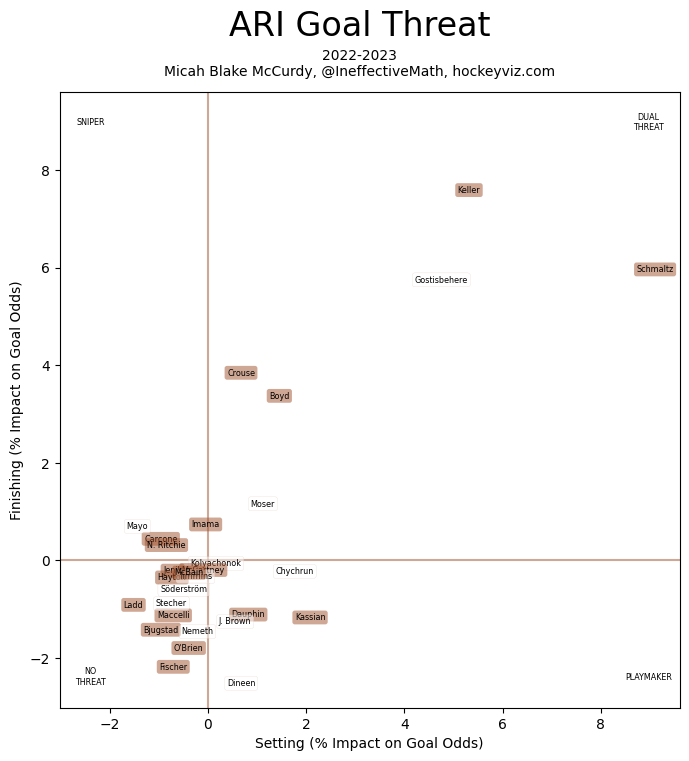
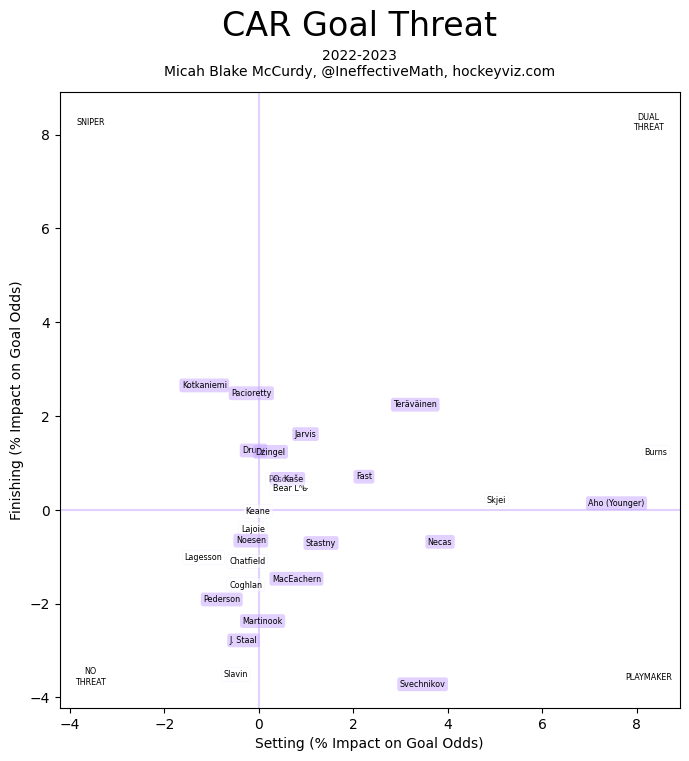
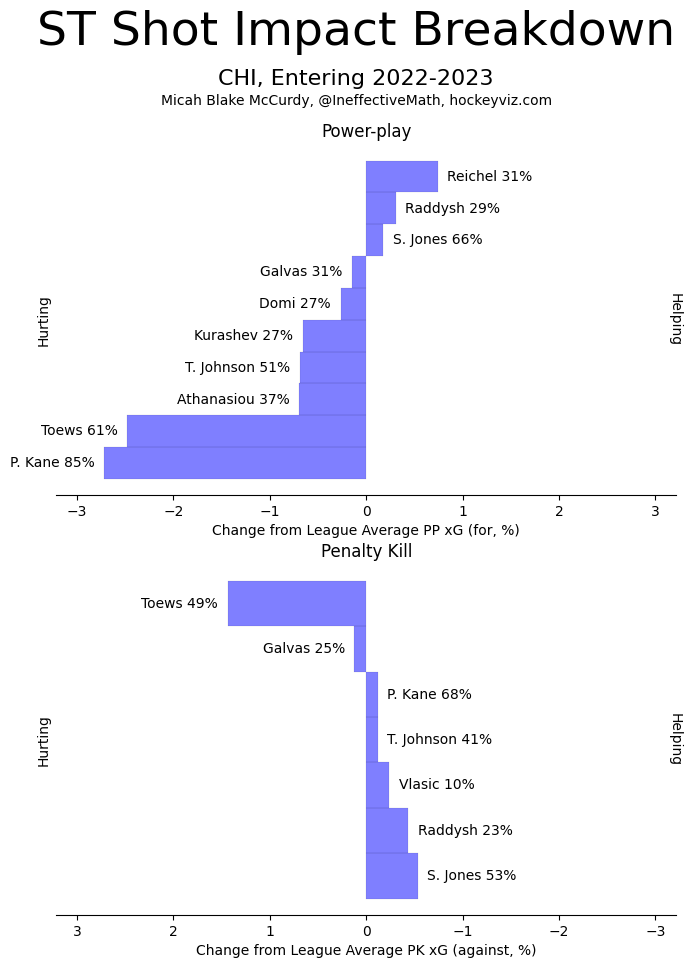
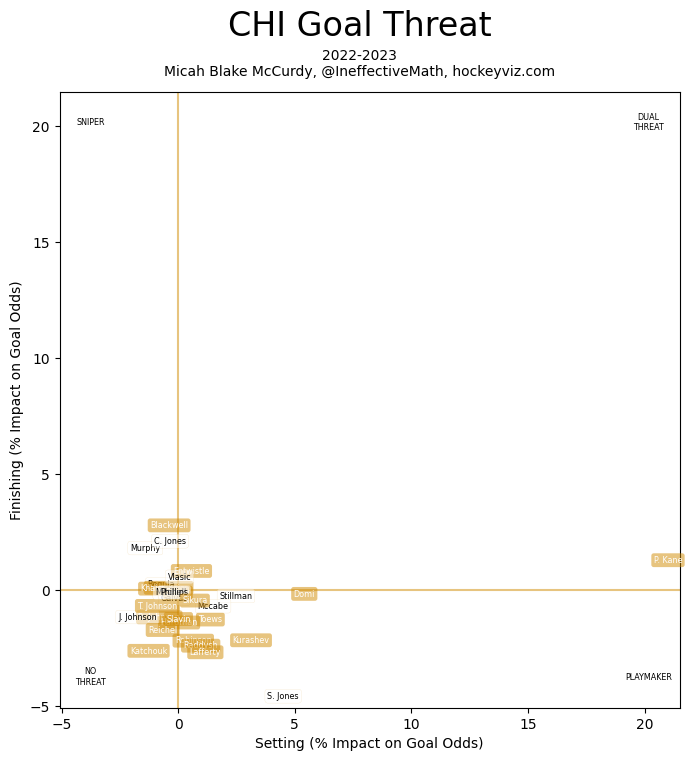
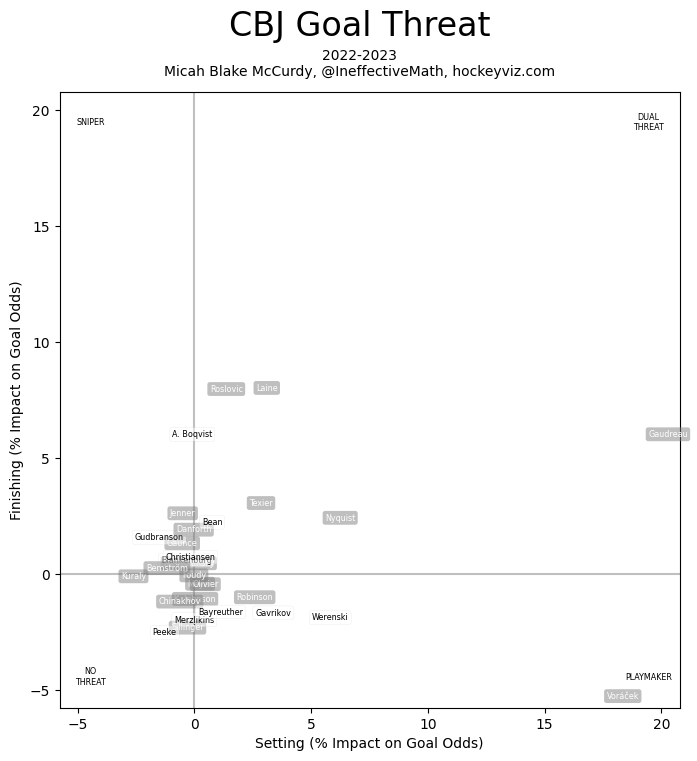
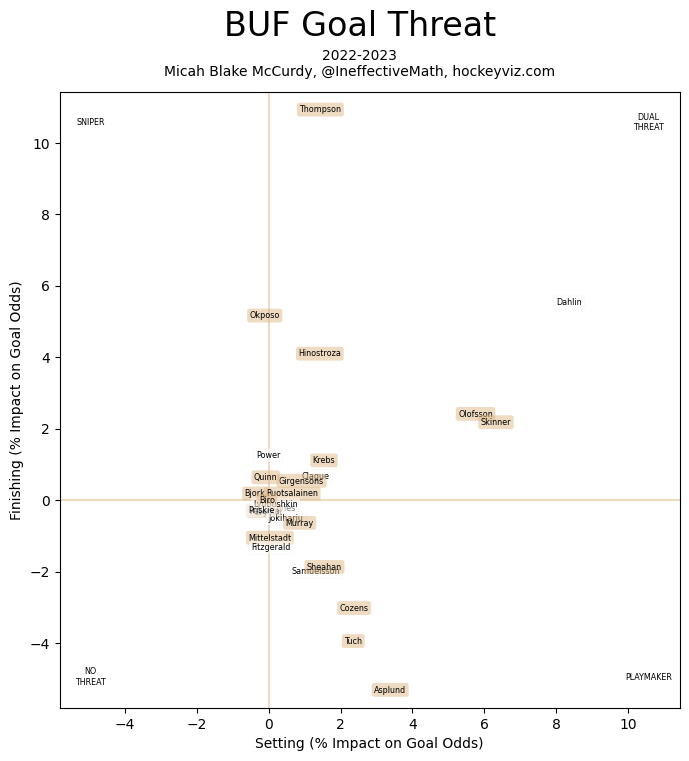
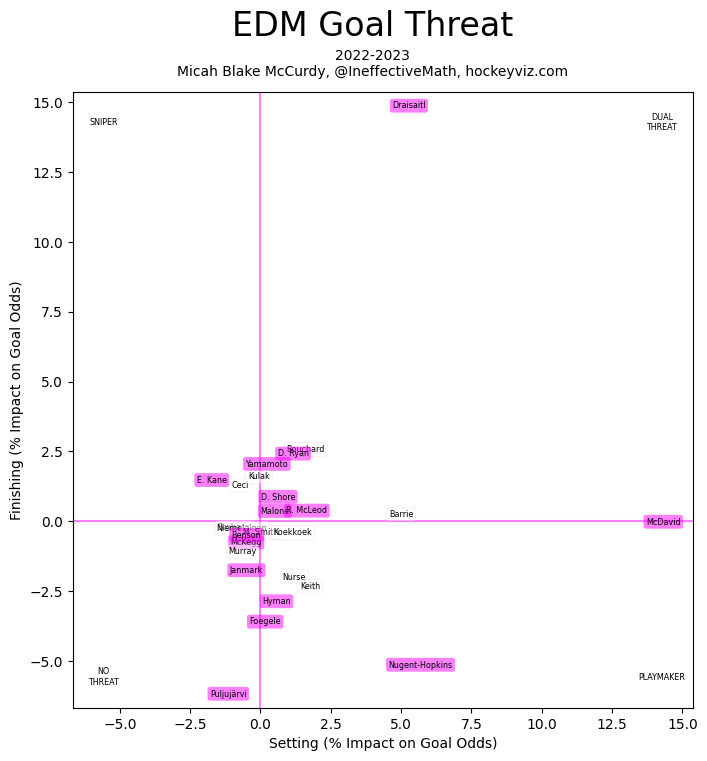
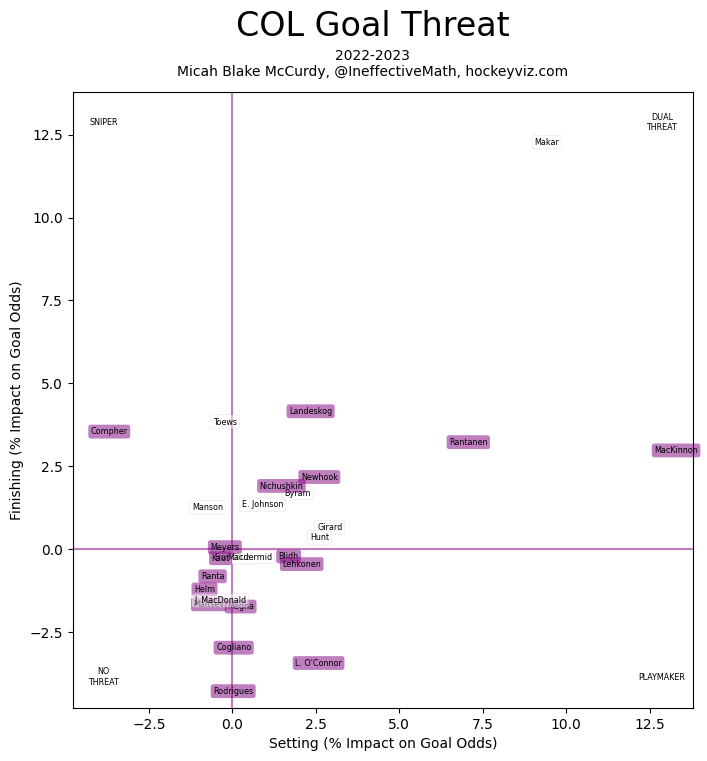
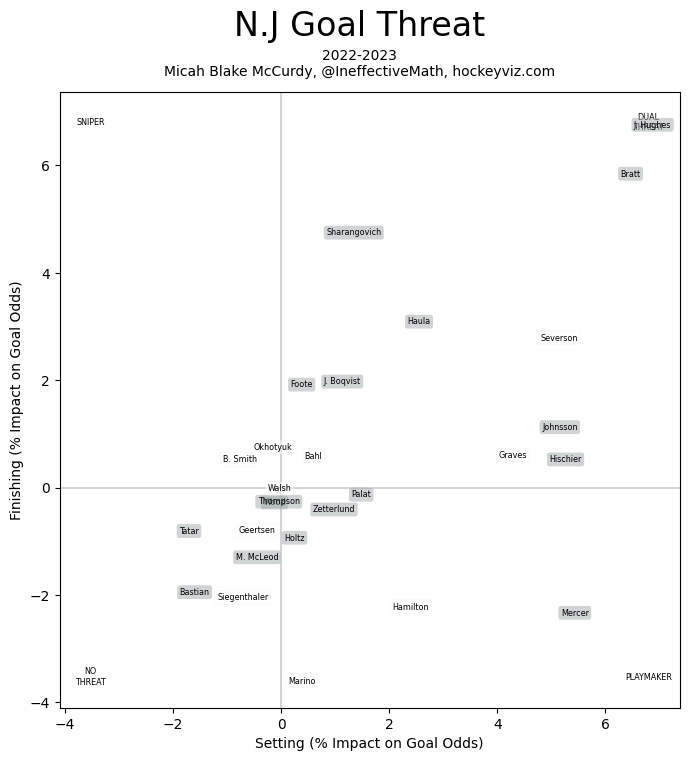
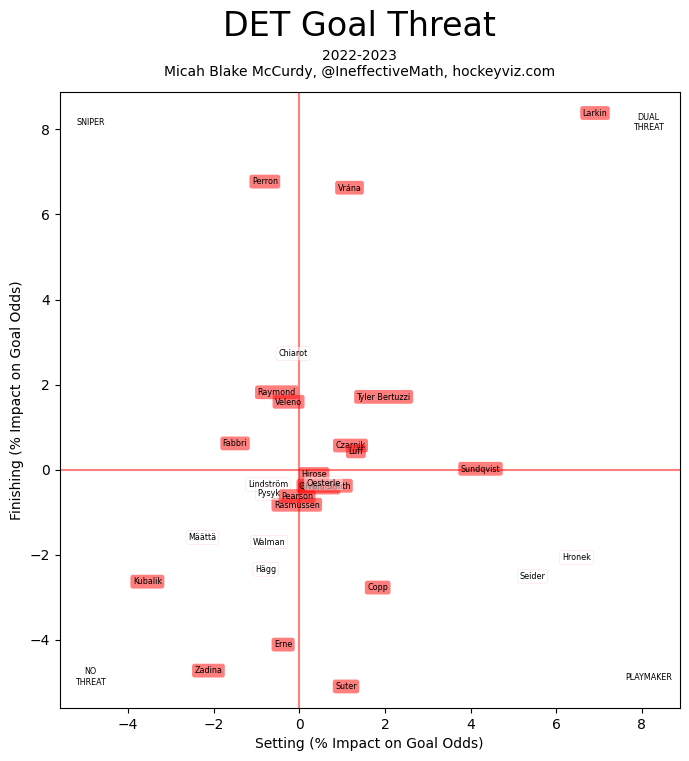
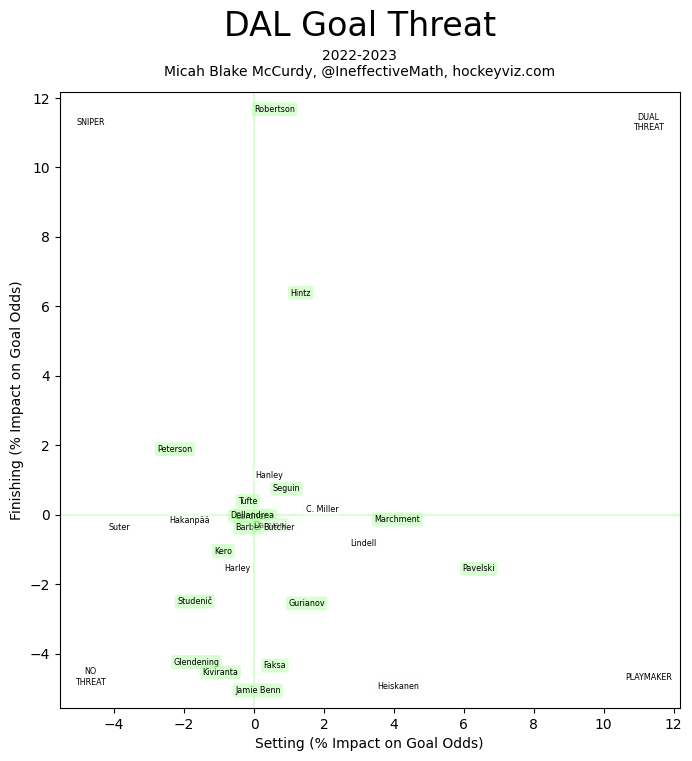
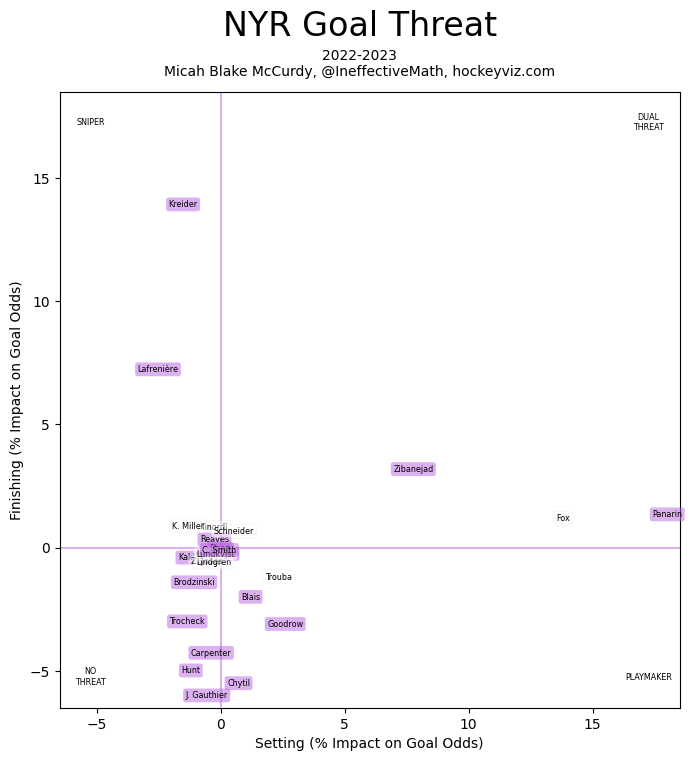
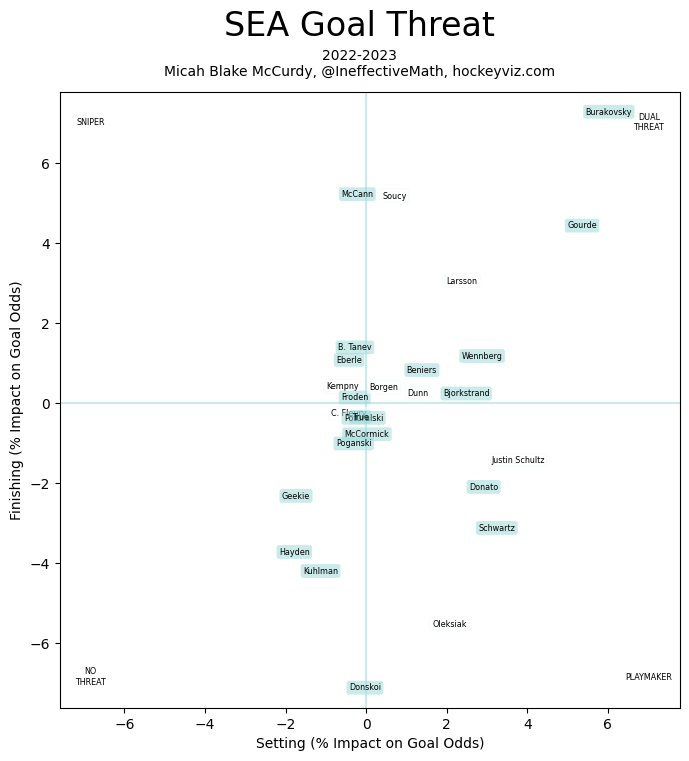
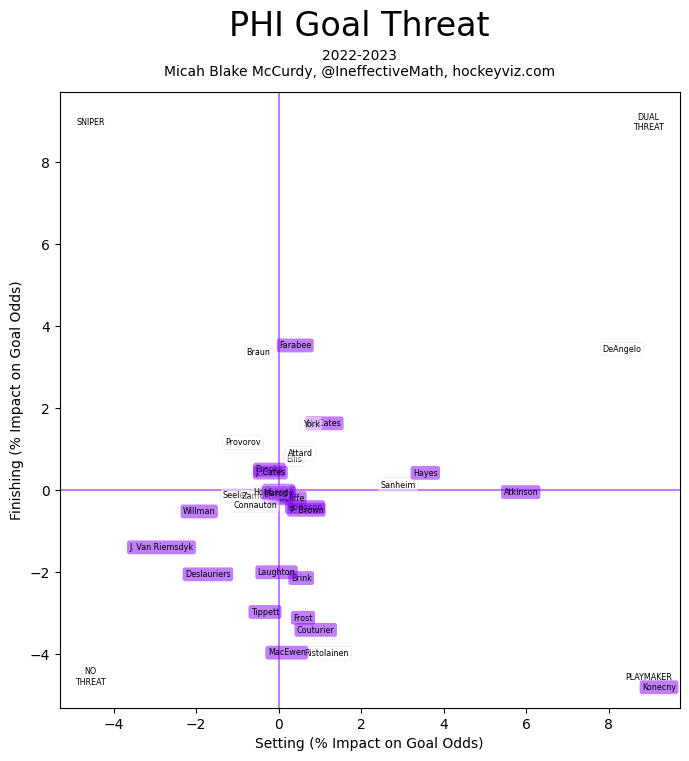
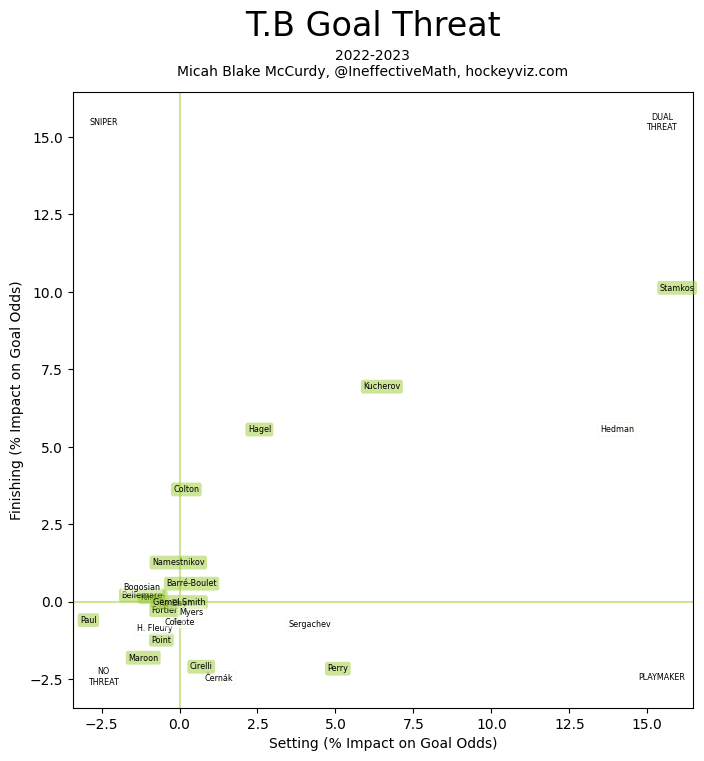
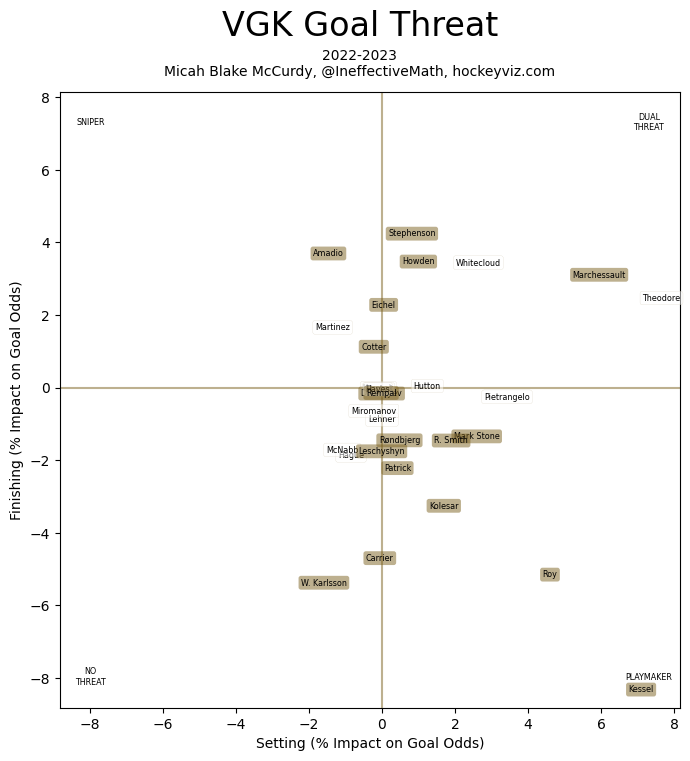
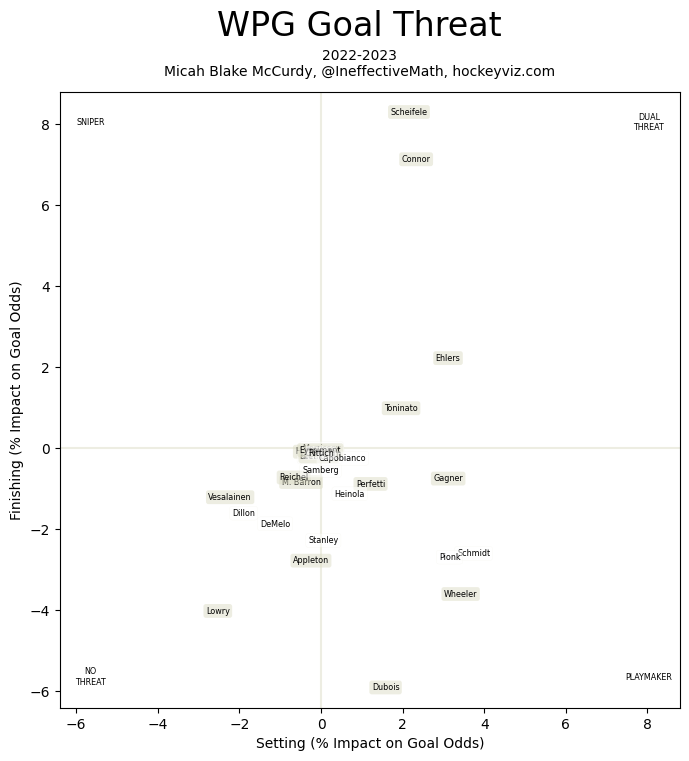
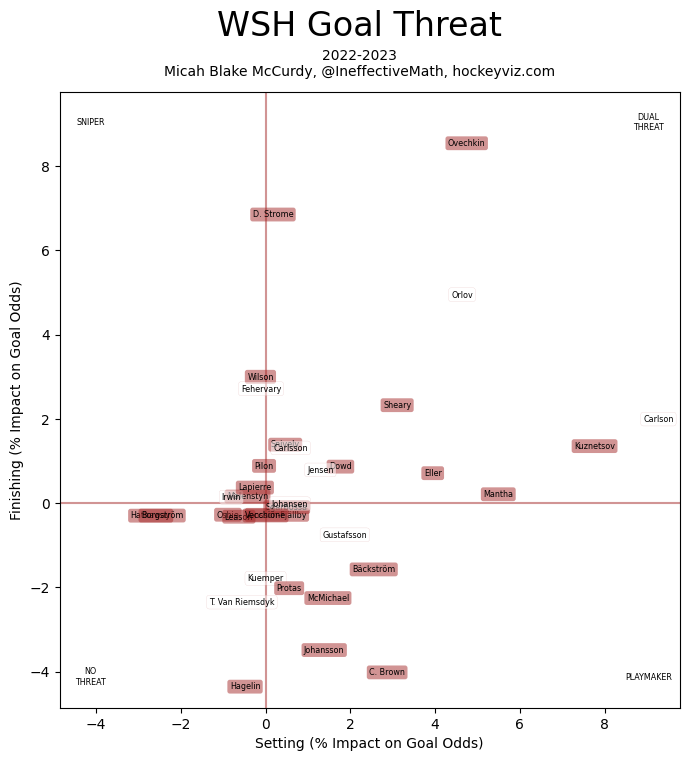
Shooting and Saving
In addition to the shot volume and quality, some skaters (by passing and by shooting) are better at converting chances than others, and, even more obviously, some goaltenders are better than others at preventing those chances from becoming goals.
In per-shot terms, the range of goaltender impacts on goal odds is only slightly wider than the range of shooter impacts, but a team's shots are generated by a much broader range of players than the range of goaltenders who will try to stop the shots which that team allows. This produces the sharp difference in the range of team-level goaltending, being three or four times broader than the range in team-level finishing talent.
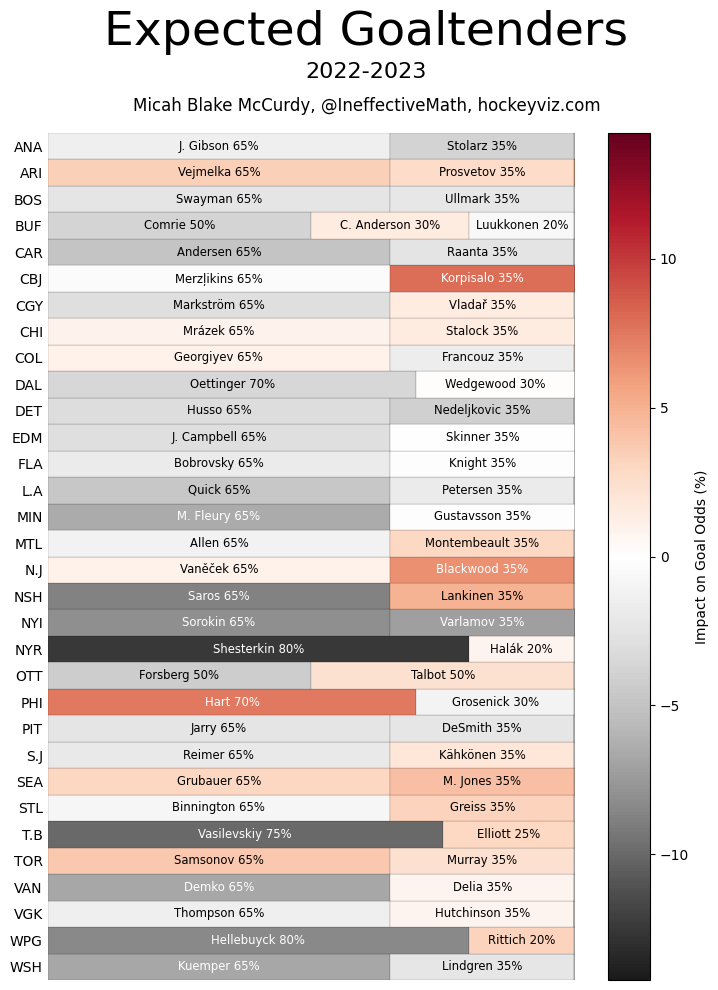
The values I use for goaltender and shooter ability are not as easily interpretable as the previous measurements, but they can still be understood with odds ratios; for instance, the odds of a shot taken against a Philadelphia or Toronto goaltender becoming a goal are 4% higher than a similar shot taken against a league-average goaltender. For the Rangers, the high value is primarily due to Igor Shesterkin (the best goaltender in the league) unlike in most of the other strong teams, where both goalies in the expected tandem are very strong.
This year, for predictions, I have decided to estimate the ability of each goaltender using both their (individual) results from 2021-2022 and also from 2020-2021. (In previous years I have used only one previous season.) This change very slightly increases the per-shot accuracy of my models.
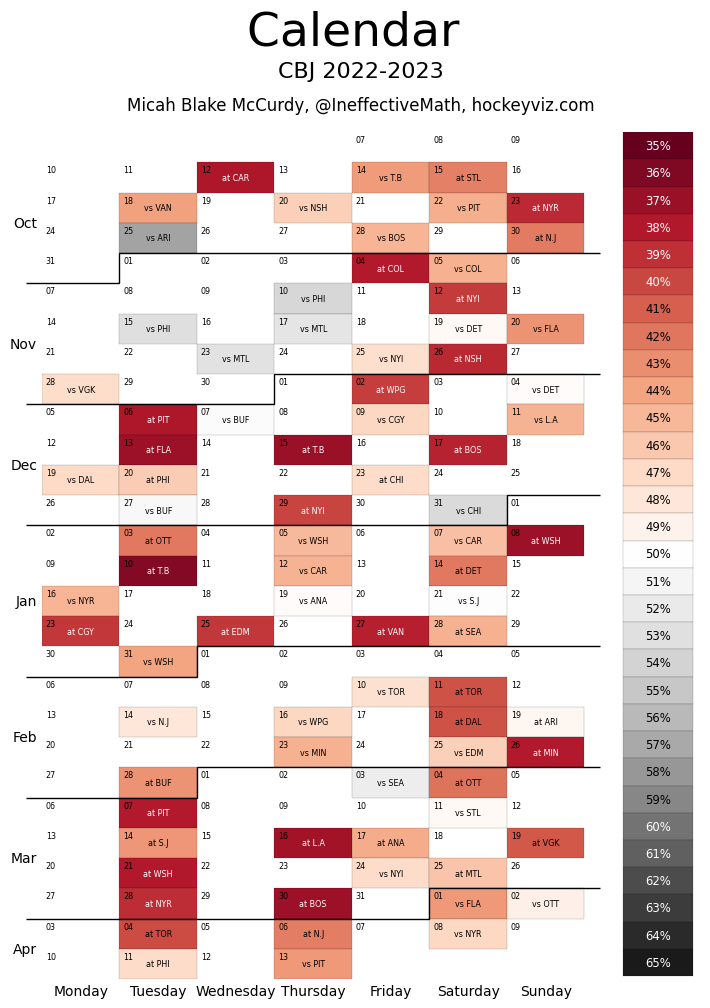
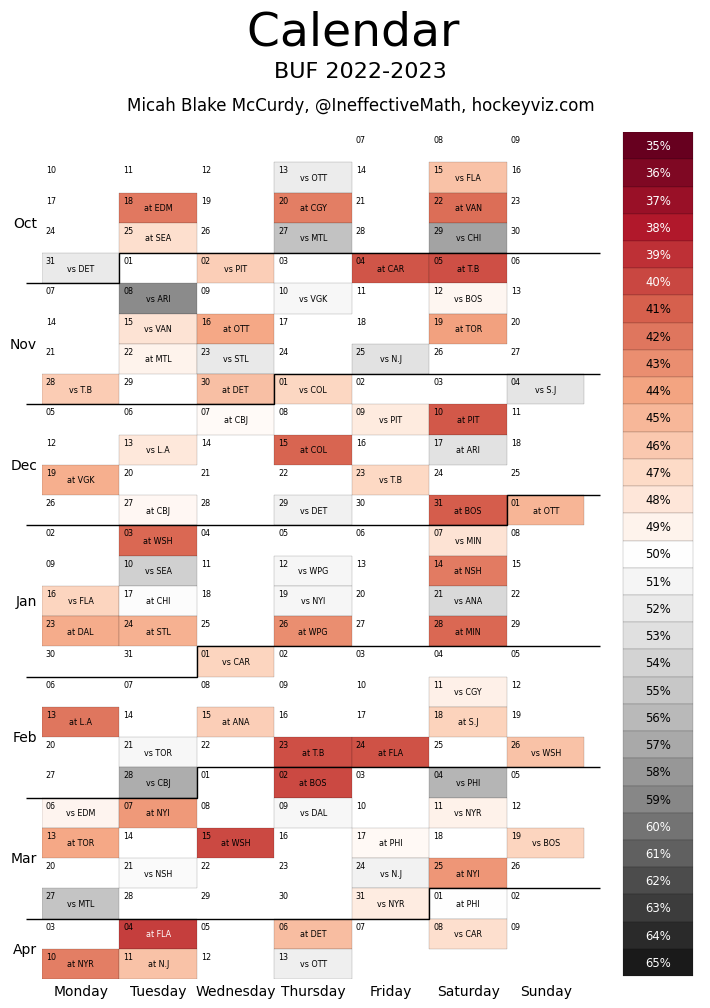
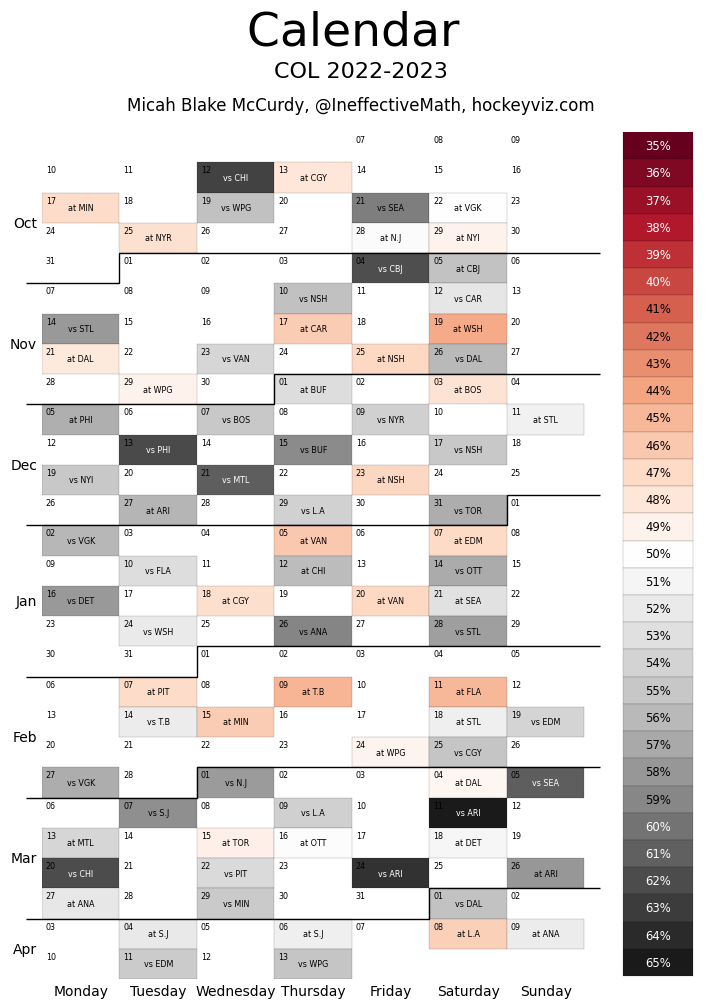
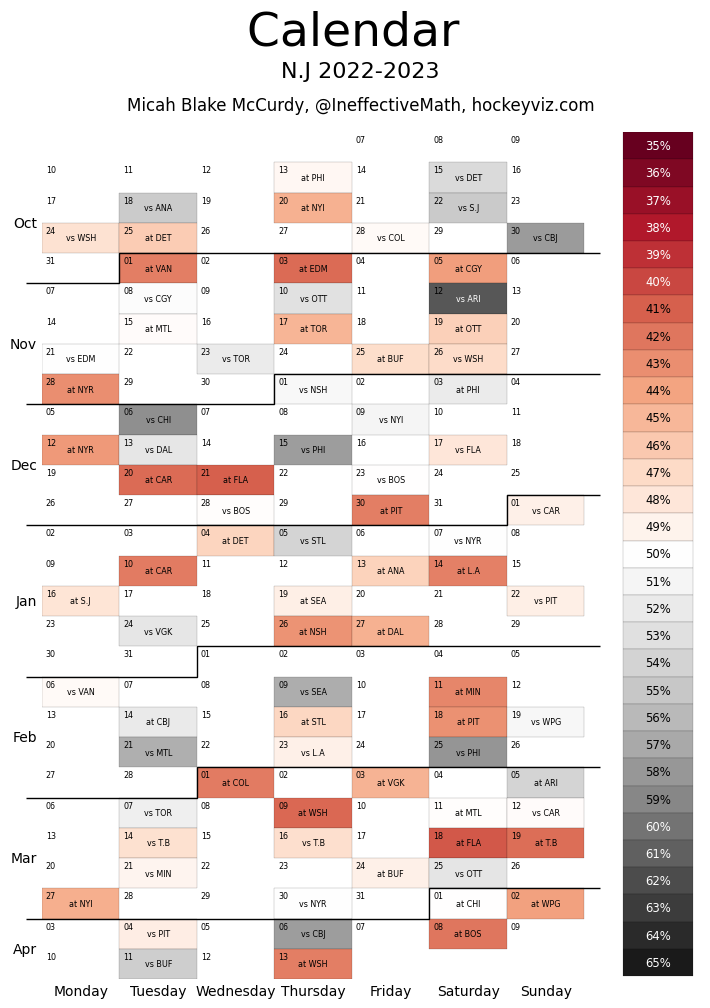
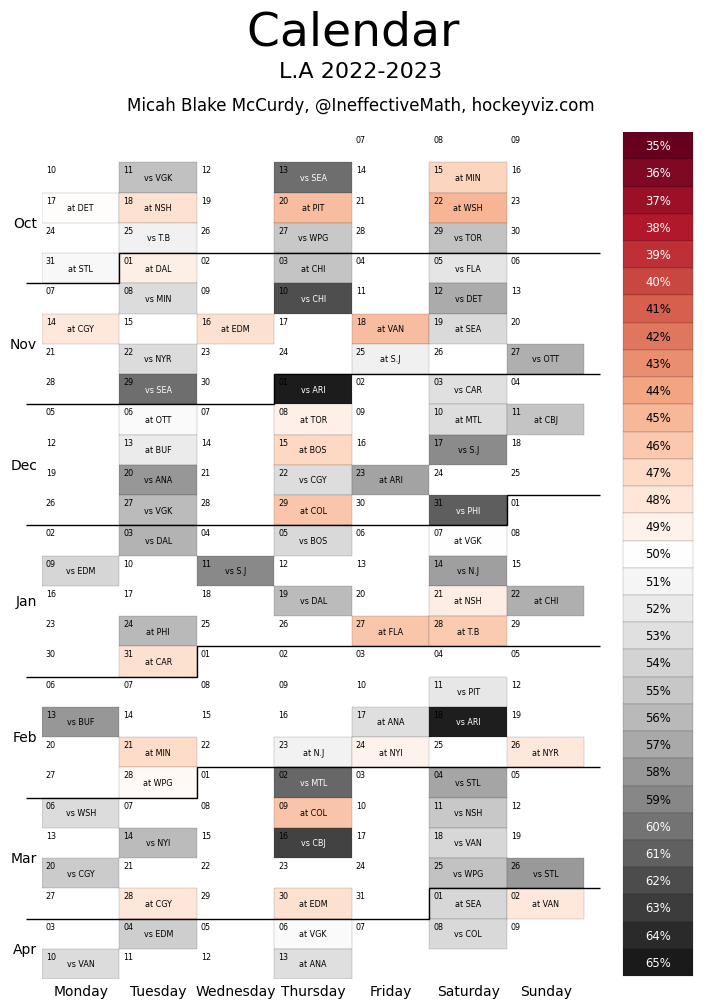
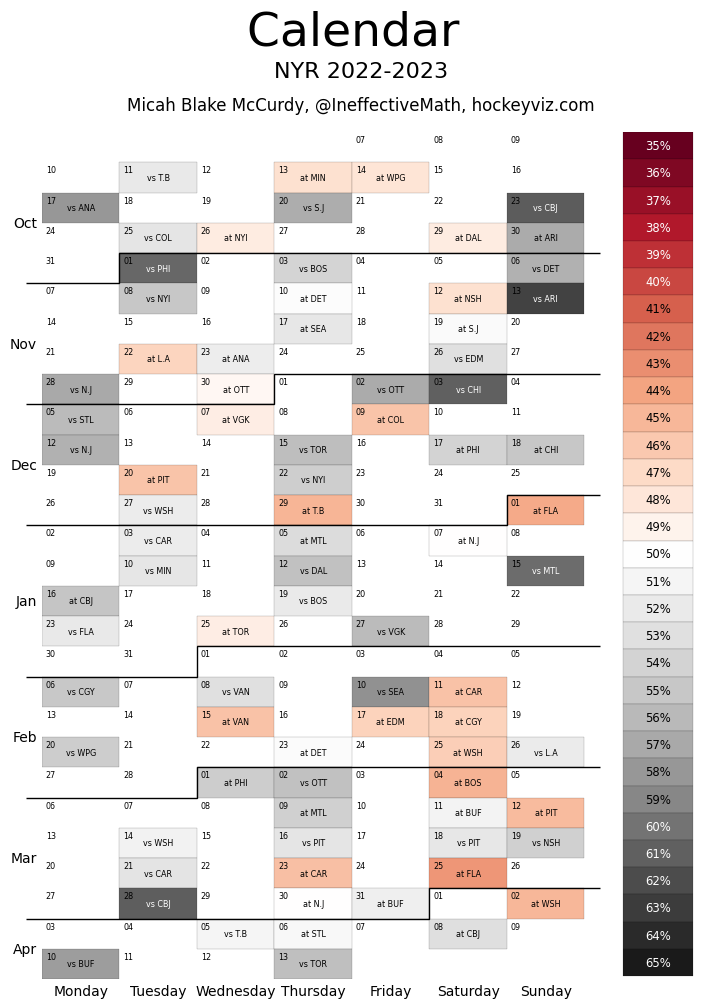
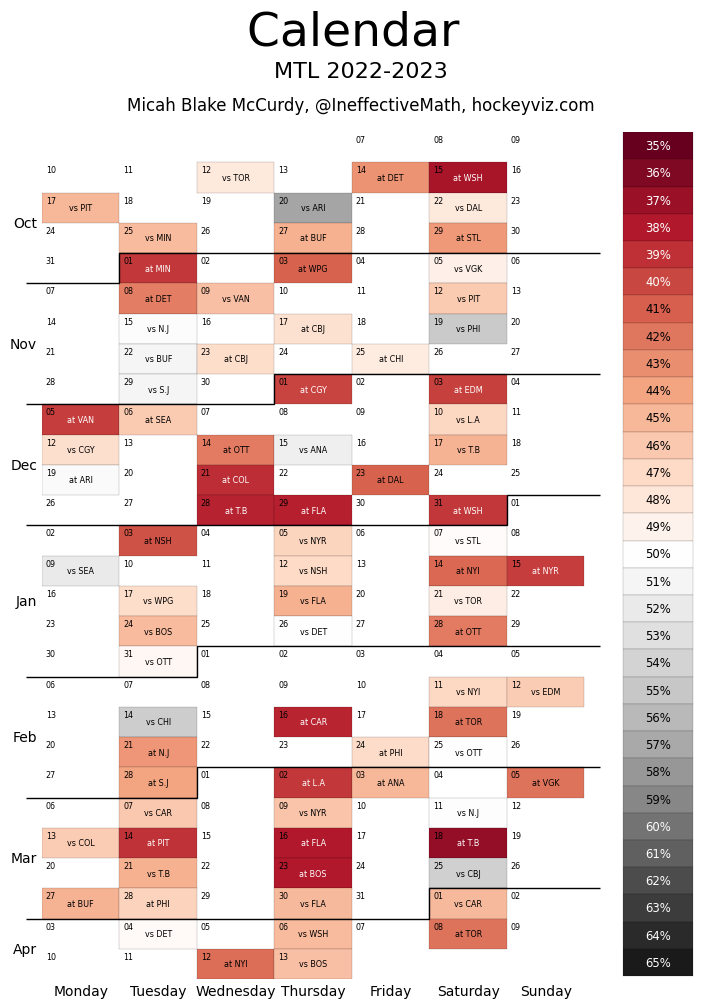
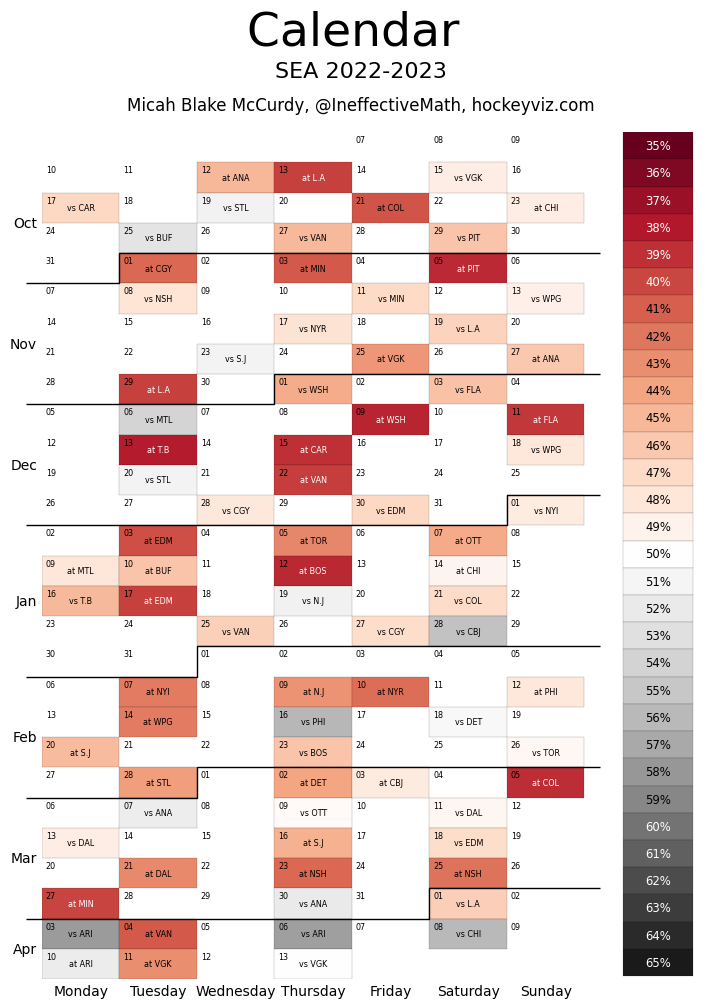
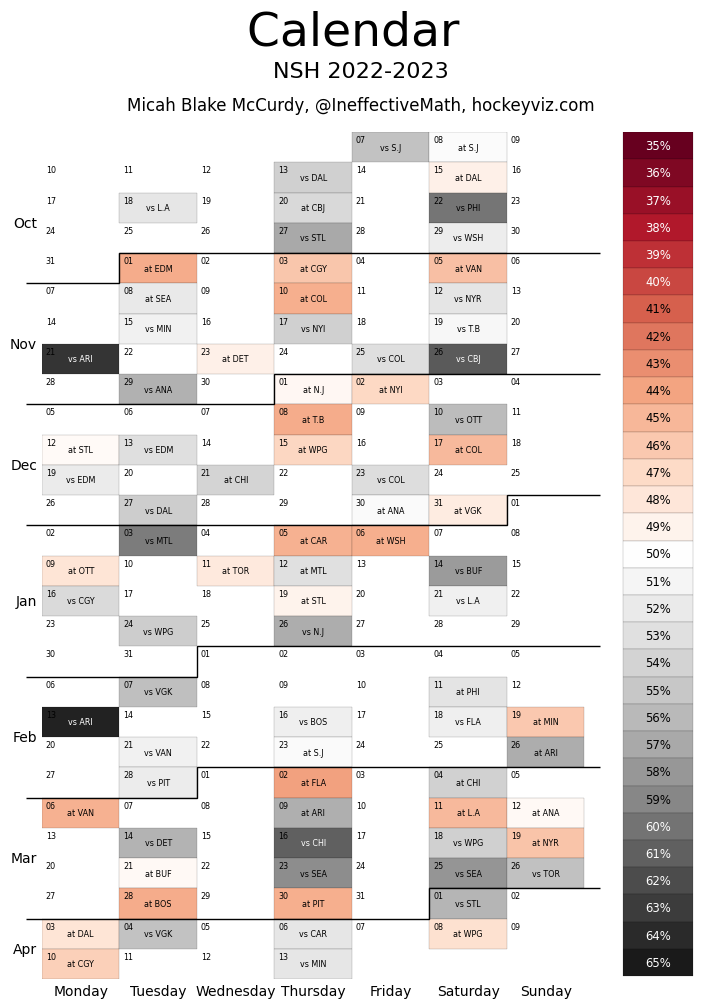
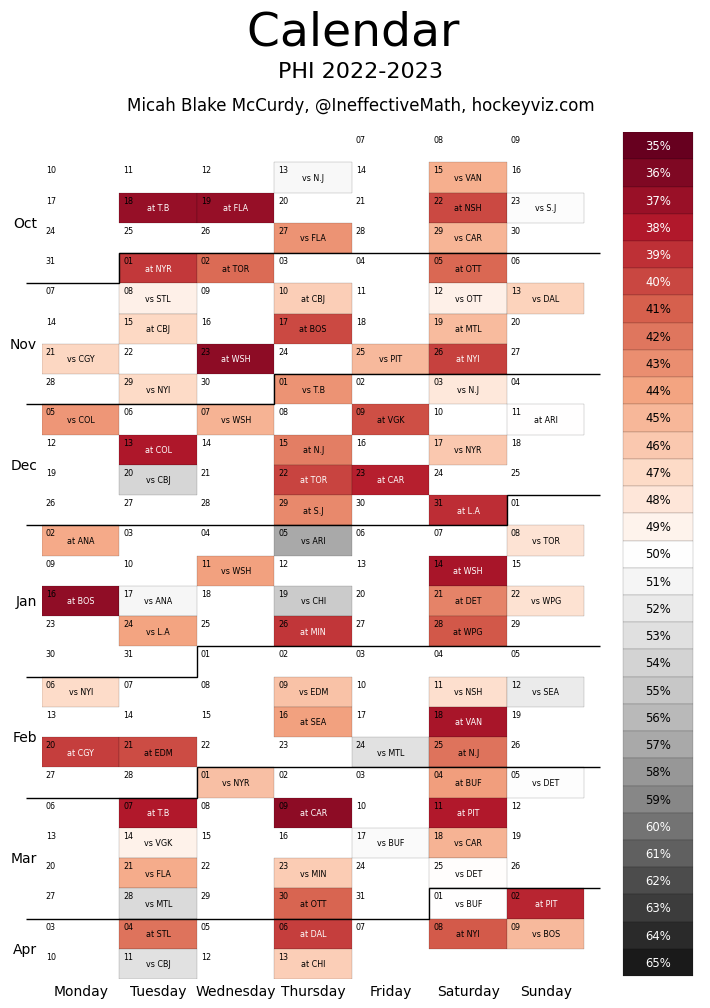
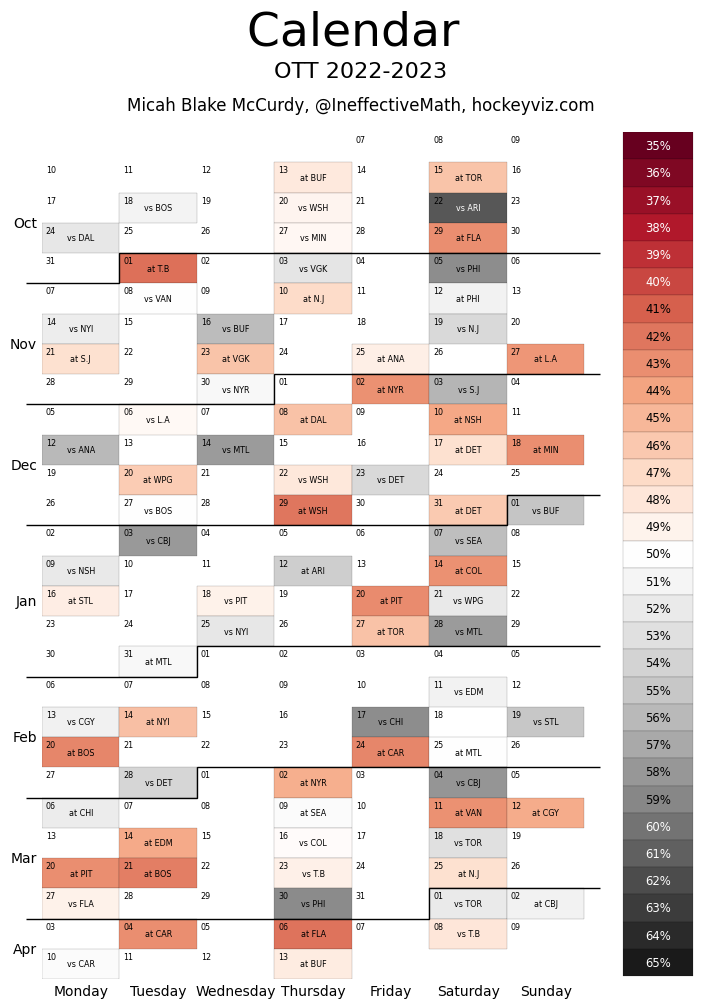
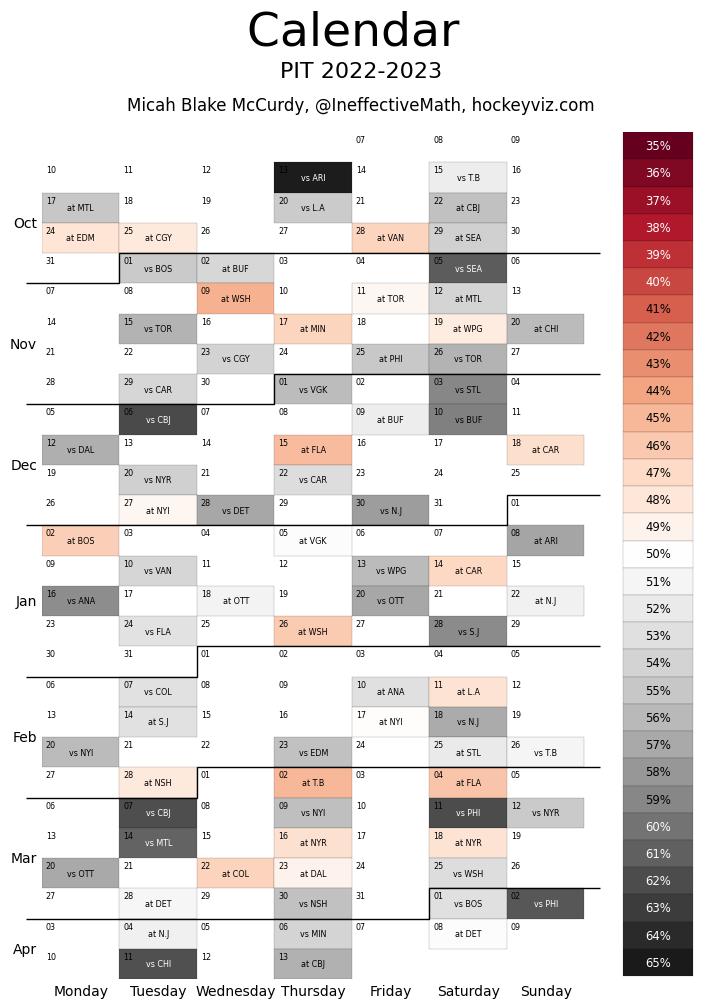
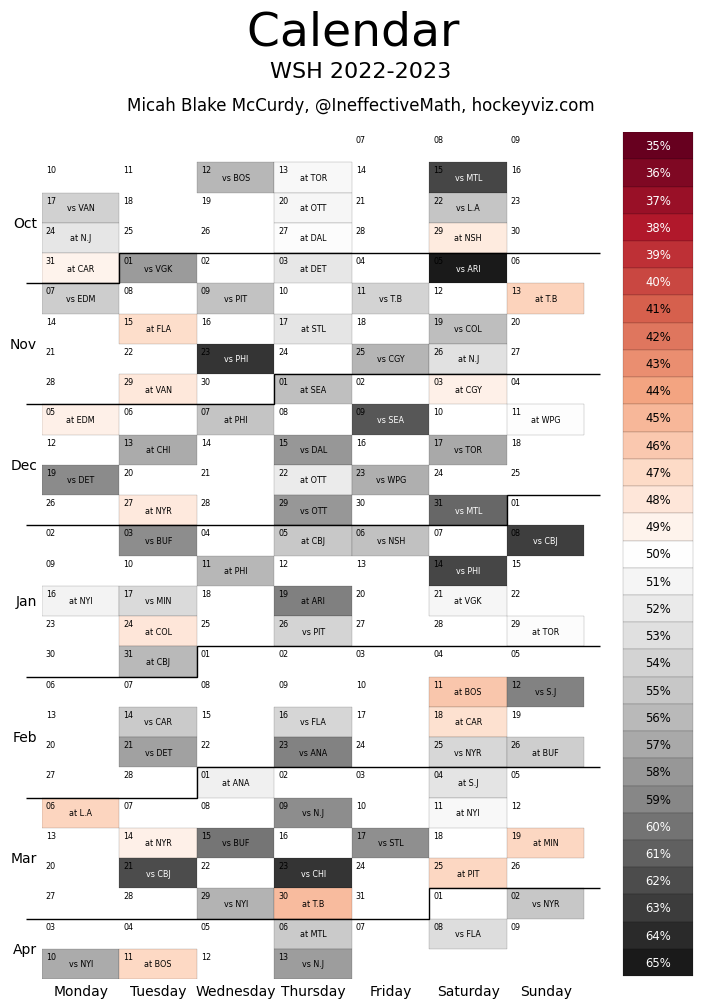
Fatigue
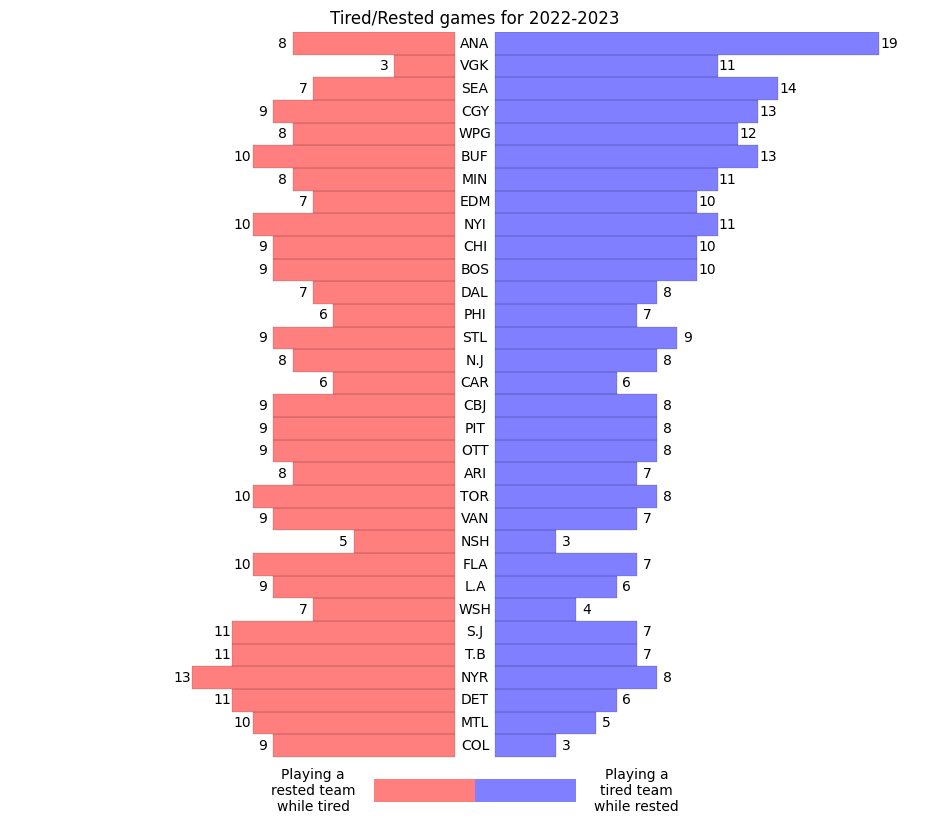
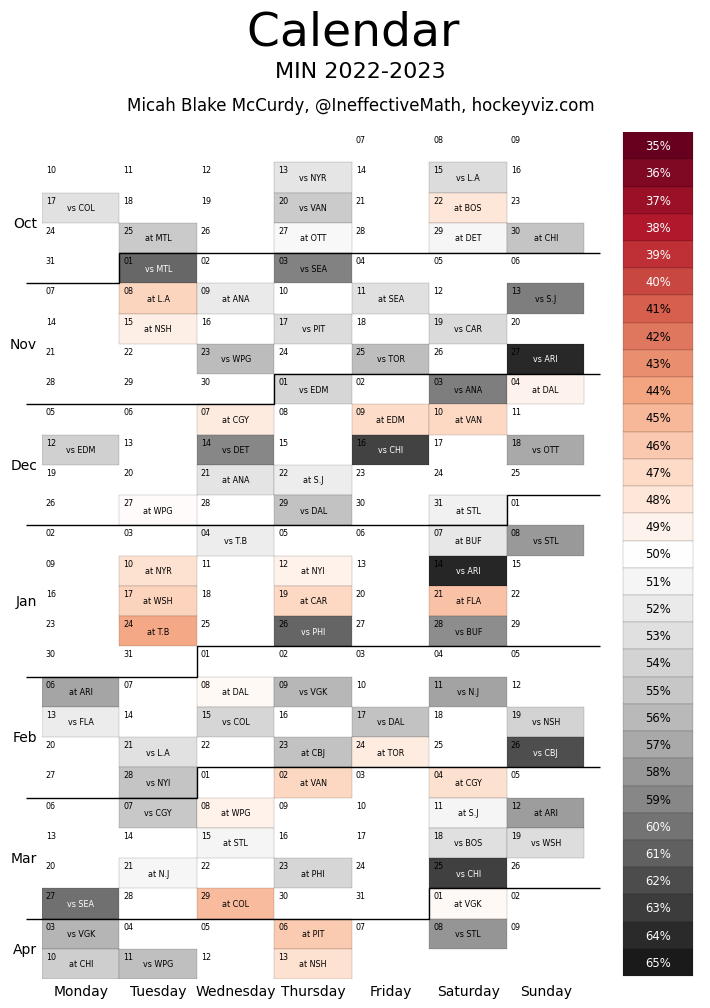
All of the above is taken entirely from the team's roster and coach, without regard to the schedule. Of course, not every team has the same schedule, which affects how well they are likely to perform. Not all teams are equally affected by fatigue. The strongest effects from rest are seen when teams play after playing the night before. The table below shows how many times each team plays 'tired' in this sense, as well as how many times they play against a team that is tired. Games played between teams which are both tired in this sense are not counted, since neither team has a rest advantage.
This season, the Ducks have by far the most-favourable rest schedule, with a net-eleven games more playing at rest advantage versus rest disadvantage. The defending premier Colorado have the least-favourable rest schedule, playing at rest disadvantage six more times than at rest advantage. The combined advantage (in terms of shot rates) of playing rested vs a tired opponent is approximately 11.5%, compared to a league-average rate.
Points and Playoff Chances
The most important factor of the schedule, though, is not rest but the fact that teams do not all play against the same opposition. To measure the effect of this imbalance, only simulation will suffice, the results of which are presented below.

Each team's bar is centred on the average point total obtained in the simulations for each team, sorted with the highest averages to the right, with the divisions indicated by colour. The changing colour intensities indicate "stanines", that is, each coloured square shows half of one standard deviation.
Thus, we expect:
- six or seven of the thirty-two teams to finish in the darkest box (very close to their name);
- ten or eleven teams to fall into the adjacent boxes;
- seven or eight to fall into the next pair of boxes;
- four or five into the next pair, and
- two or three teams to fall into the faintest boxes or even beyond.

| Canucks | 95.7 | 8.4 | 72% |
| Kings | 95.6 | 8.4 | 72% |
| Oilers | 94.6 | 8.4 | 68% |
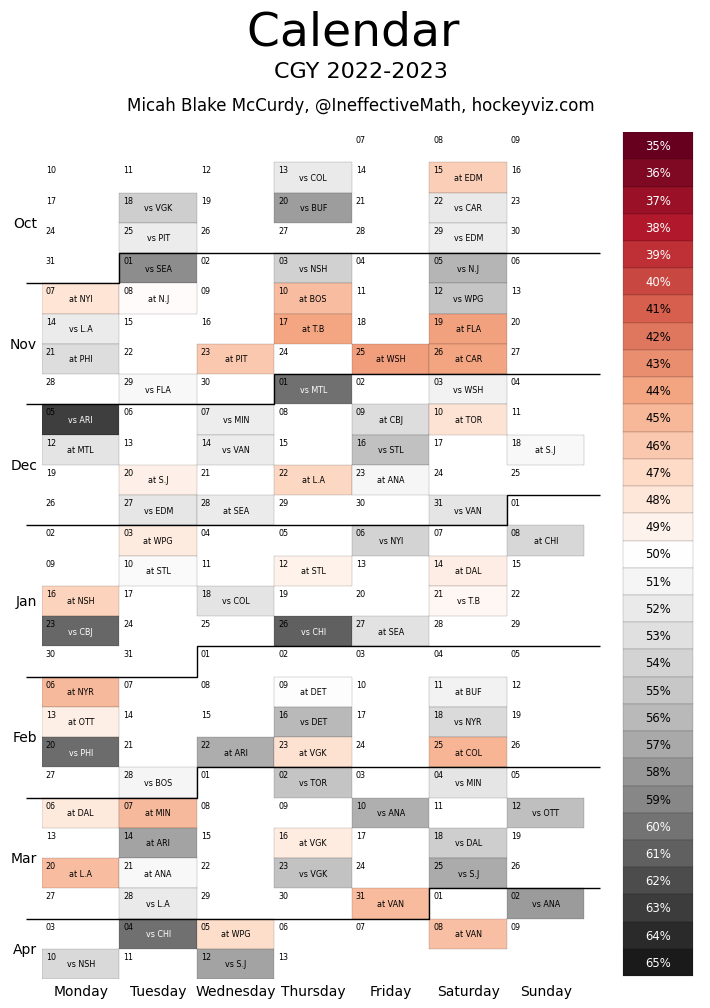
| Flames | 93.6 | 8.4 | 63% |
| Golden Knights | 90.7 | 8.5 | 50% |
| Sharks | 87.4 | 8.5 | 34% |
| Ducks | 86.7 | 8.5 | 31% |
| Kraken | 84.4 | 8.5 | 22% |
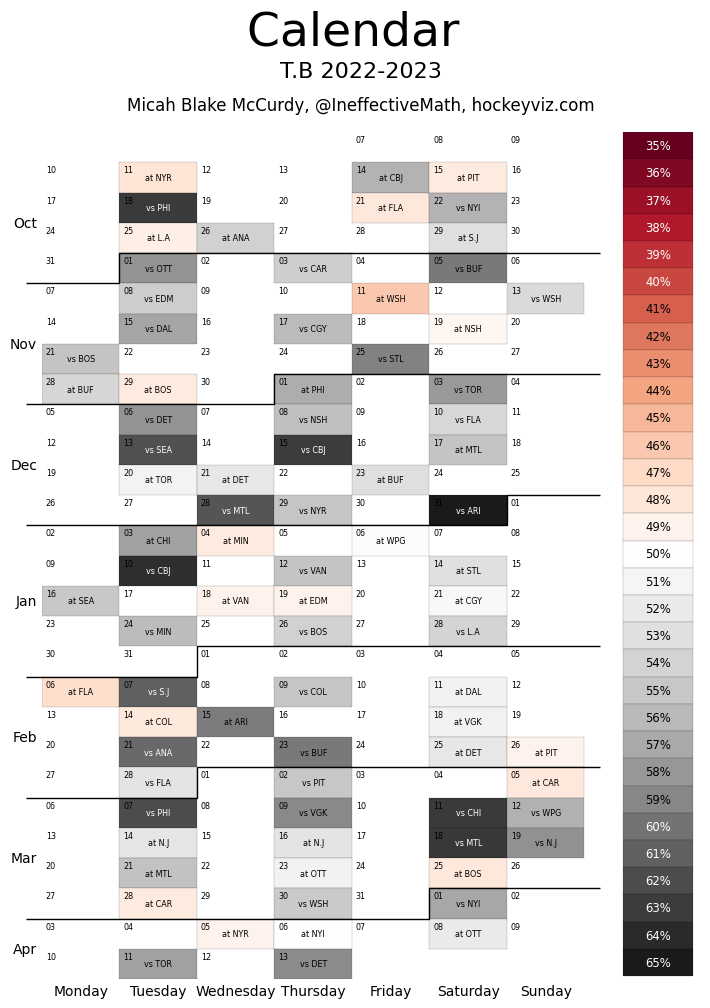
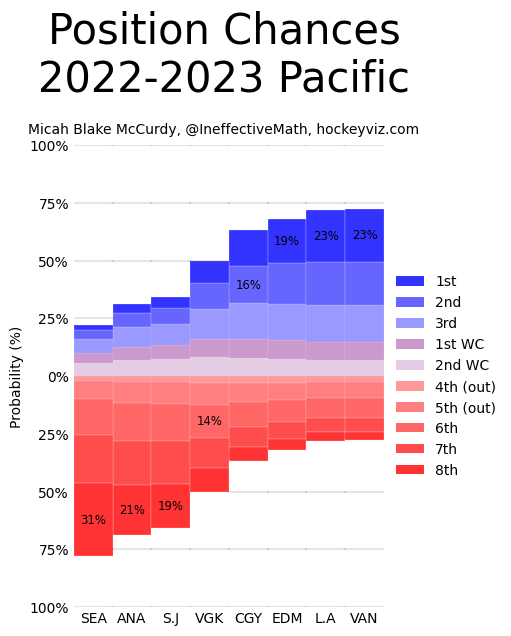
By far the most interesting division (to me) is the Pacific, where upheaval (Calgary) or persistent management confusion (Edmonton) or both (Vegas) have opened up the division. Vancouver's strengths lie primarily in their very good goaltending combined with their recent upgrade in coaching; the division on the whole is fairly weak.
Every team's most likely finishing position is marked in the Position Chances graph. Seattle, hamstrung with a weak offence and weak goaltending, are most likely to finish eighth (the marked 31%) but have a smallish (∼22%) possibility of making the playoffs.
Playoff cutoff: 90.8 points
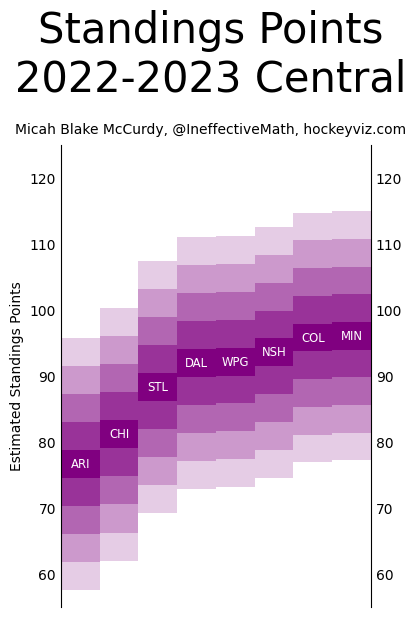

| Team | Mean points | Standard Deviation | Playoff Chance |
|---|---|---|---|
| Wild | 96.1 | 8.4 | 75% |
| Avalanche | 95.8 | 8.4 | 74% |
| Predators | 93.6 | 8.4 | 64% |
| Jets | 92.2 | 8.4 | 58% |
| Stars | 92.0 | 8.5 | 57% |
| Blues | 88.3 | 8.5 | 40% |
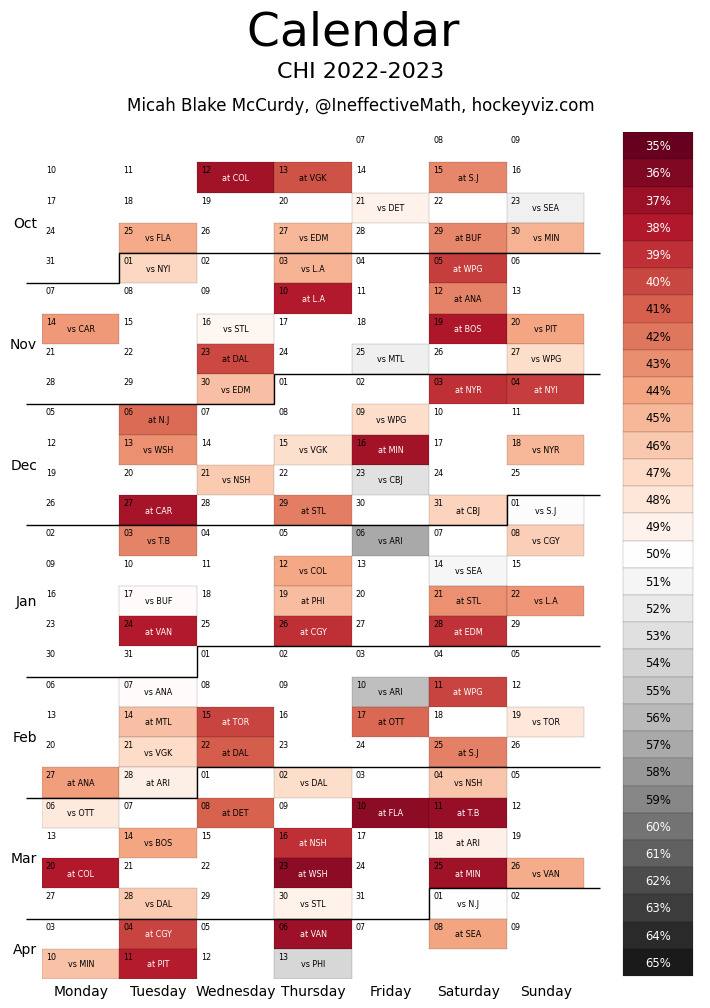
| Chicago | 81.2 | 8.5 | 13% |
| Coyotes | 76.7 | 8.5 | 5% |
Defending champs Colorado remain very strong despite downgrading their goaltending somewhat; Minnesota with their exceptionally strong team defence and good goaltending are perhaps somewhat more surprising. Much here relies on Marc-André Fleury playing up to his (undeniably excellent) recent results. I do not explicitly adjust my predictions for age, and this year will be his age thirty-eight season.
Both Arizona and Chicago have mustered woefully weak rosters, though Chicago still have a few players who have at least one or two non-trivial skills. All of the other teams in the division should pad their totals somewhat by virtue of playing them often.
Playoff cutoff: 90.5 points.


| Team | Mean points | Standard Deviation | Playoff Chance |
|---|---|---|---|
| Capitals | 97.6 | 8.4 | 78% |
| Penguins | 96.0 | 8.4 | 72% |
| Hurricanes | 96.0 | 8.4 | 72% |
| Rangers | 94.4 | 8.4 | 65% |
| Islanders | 92.2 | 8.4 | 54% |
| Devils | 88.3 | 8.5 | 36% |
| Flyers | 81.5 | 8.5 | 12% |
| Blue Jackets | 81.3 | 8.5 | 12% |
The metropolitan division is considerably tighter at the top than at the bottom. Columbus picking up Johnny Gaudreau helps them considerably but the remainder of the roster being as it is leaves them in the dregs of the division, alongside Philadelphia. The capitals upgraded considerably in goal by acquiring Darcy Kuemper, but otherwise will win games primarily off the back of their very strong 5v5 and 5v4 defence. The Rangers have exceptionally strong goaltending but will struggle for stretches to generate even-strength chances.
Playoff cutoff: 91.3 points.
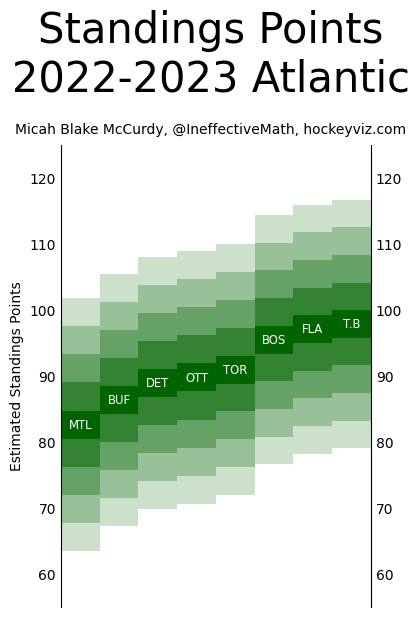

| Team | Mean points | Standard Deviation | Playoff Chance |
|---|---|---|---|
| Lightning | 97.9 | 8.4 | 79% |
| Panthers | 97.1 | 8.4 | 76% |
| Bruins | 95.5 | 8.4 | 70% |
| Leafs | 91.0 | 8.5 | 49% |
| Senators | 89.8 | 8.5 | 43% |
| Wings | 89.0 | 8.5 | 39% |
| Sabres | 86.3 | 8.5 | 28% |
| Canadiens | 82.6 | 8.5 | 15% |
The strongest division in the league this year is the atlantic, led by the two floridian teams together with perennial-trouble-causer Boston. Were it not for the very weak Murray-Samsonov tandem; Toronto (with their extremely strong skaters) would also be alongside those three at the top of the division (and the league). Ottawa have strengthened considerably, enough to put them into the middle of the pack.
Playoff cutoff: 91.3 points.
Wooden Spoon
| Team(s) | Chance of First overall pick |
|---|---|
| ARI | 10.7% |
| CHI | 7.7% |
| MTL | 7.6% |
| CBJ | 7.6% |
| PHI | 7.5% |
| SEA | 5.7% |
| BUF | 4.6% |
| ANA | 4.4% |
| S.J | 4.1% |
| STL | 3.6% |
| N.J | 3.6% |
| DET | 3.3% |
| OTT | 3.0% |
| VGK | 2.6% |
| TOR | 2.5% |
| DAL | 2.1% |
| Team(s) | Chance of First overall pick |
|---|---|
| NYI | 2.1% |
| WPG | 2.0% |
| CGY | 1.6% |
| NSH | 1.6% |
| NYR | 1.4% |
| EDM | 1.4% |
| BOS | 1.2% |
| CAR | 1.1% |
| COL | 1.1% |
| L.A | 1.1% |
| PIT | 1.1% |
| VAN | 1.1% |
| MIN | 1.0% |
| WSH | 0.8% |
| T.B | 0.7% |
| FLA | Nil |
Since the league still hasn't yet implemented Gold drafting (which guarantees a full slate of exciting games for fans of all teams, win or lose, while eliminating tanking and giving the best picks to the worst teams), many teams will once again play many games at the end of the year which would be in their best interests to lose. Although there will be many trades and confusions between now and the end of the year, these are the early probabilities (including all lotteries) for who will get the 2023 first overall draft pick.
The Florida chance is zero because they traded their first-round pick to Montreal in the Ben Chiarot deal, and Montreal's chance is that much higher for the same reason. Despite having the clear weakest roster in the league, Arizona's chance of picking first overall remains small. The lottery as currently instituted manages to somehow create the worst possible system, where fans of weak teams clamour for them to lose despite getting little in return.