Various people have made models to try to predict the likelihood of teams making the playoffs:
- My model, Cordelia, published on this site,
- Peter Tanner's model, published at Moneypuck.com,
- Dominik Luszcyzszyn's model, published on his twitter account @domluszczyszyn,
- Sports Club Stats, on their website.
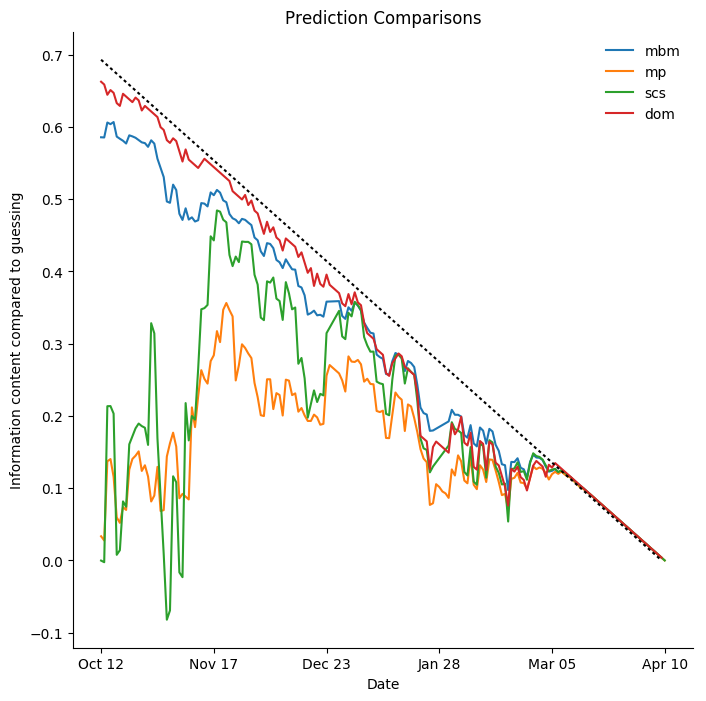
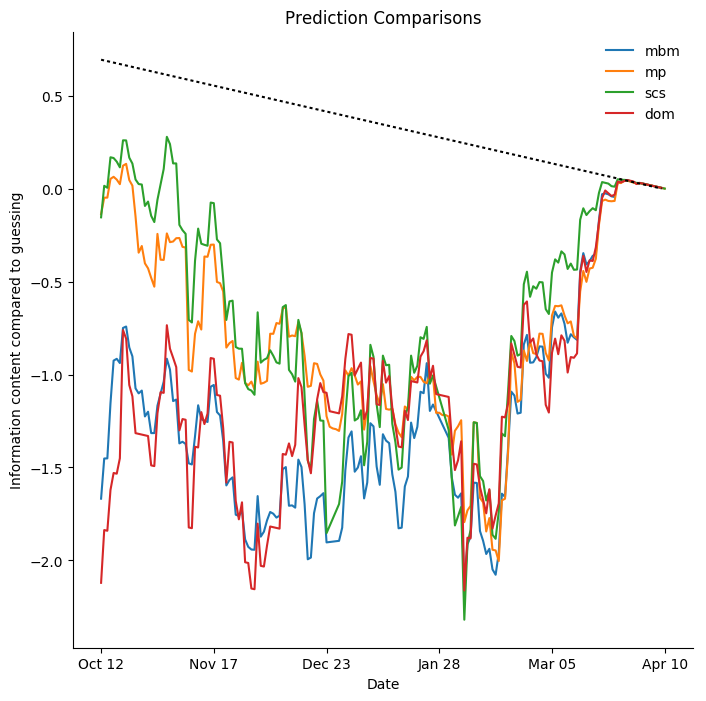
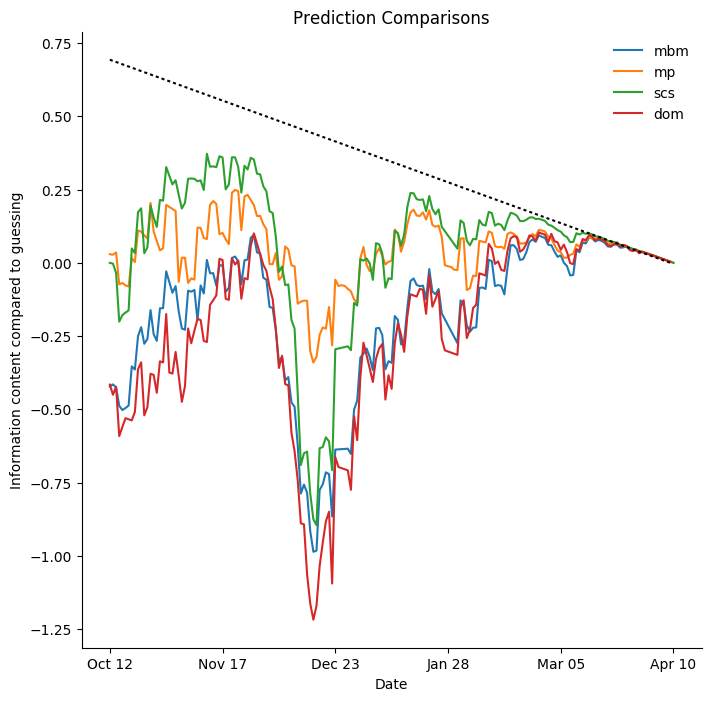
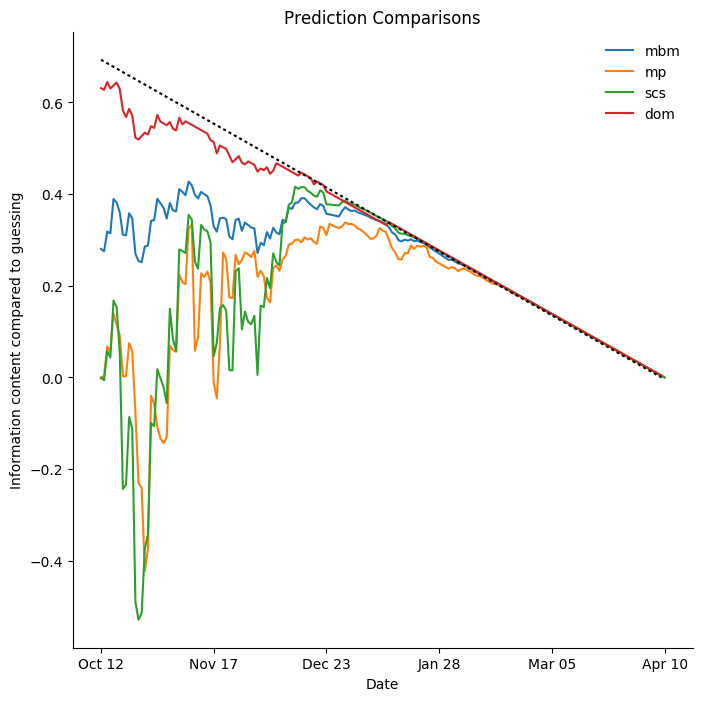
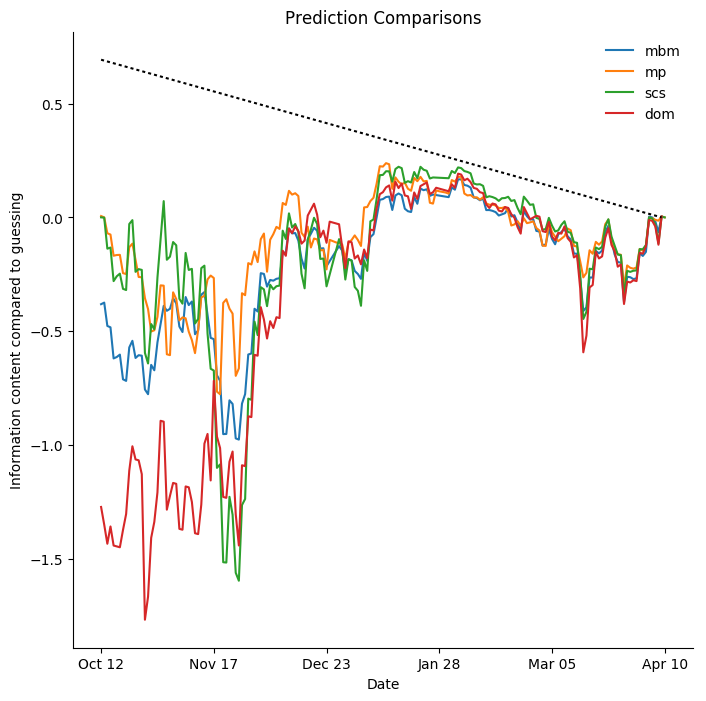
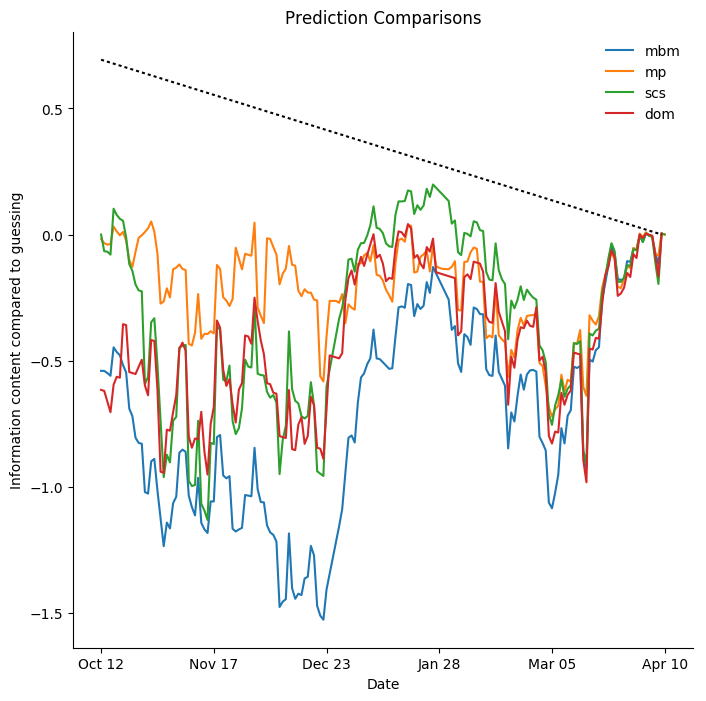
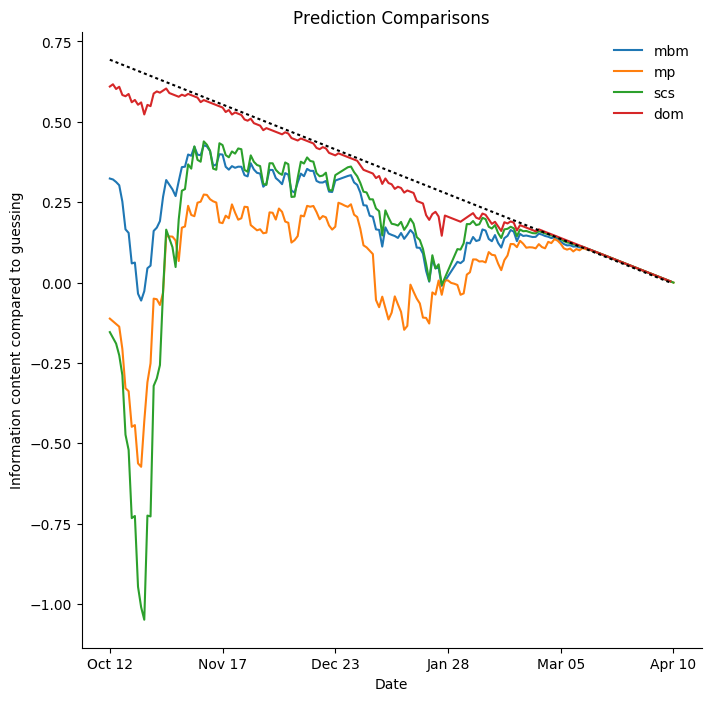
So, I take log loss as my starting point for evaluating predictions. However, there are many predictions for each team, a new one each day. I choose to compare the average log loss of all thirty predictions on each given day to a fool who resolutely assigns a chance of 50% to every team on every day of the year, no matter where they are in the standings. This doesn't give any meaning to the log loss values themselves, but it does mean that positive values are good and that zero has a meaning: as good as guessing 50% all the time. Early on, the guesser has no information about results, but as the season wears on all the models incorporate that information while the guesser does not. At the end of the season, there is nothing left to predict and the models can provide no information that the public does not have. A perfect prediction, relative to guessing, has a log loss of ln 2, so to model the amount of information the models are providing, I subtract this amount, prorated to the amount of the season that has elapsed. The result is what I call "information content compared to guessing" and it is graphed below. The dotted line indicates "perfect" predictions.

In the earliest part of the season, Dominik Luszcyzszyn's model is clearly best, mine is decent, and the others are barely above zero. This is a philosophical difference; both the moneypuck model and SCS prefer to begin from a "zero information" start where they view each season as a blank slate.
All four models discussed here are simulation-based, but they all use quite different methods to estimate the likelihoods of the home team winning individual games. The SCS model is the most "naive", using only goal counts, for and against, to estimate team strength. It forms very strong opinions very quickly, in this season, mostly correctly. All of the other models discussed here try to model some large fraction of the behaviour which leads to scoring or conceding goals, they are as a rule much slower to react to individual game results, but they all show a sharp change around the end of October, when impacts of off-season changes are becoming clear.
Team-by-team Results
Anaheim Ducks

Arizona Coyotes

Boston Bruins

Buffalo Sabres
Carolina Hurricanes

Columbus Blue Jackets

Calgary Flames

Chicago Blackhawks
Colorado Avalanche
Dallas Stars

Detroit Red Wings
Edmonton Oilers

Florida Panthers

Los Angeles Kings
Minnesota Wild
Montreal Canadiens
New Jersey Devils

Nashville Predators
New York Islanders

New York Rangers

Ottawa Senators

Philadelphia Flyers
Pittsburgh Penguins
San Jose Sharks

St. Louis Blues

Tampa Bay Lightning
Toronto Maple Leafs
Vancouver Canucks
Winnipeg Jets
Washington Capitals
