The regular season is over and you cast an excitable eye over the sixteen teams that have made the playoffs. How can you guess which ones are likely to have a deep playoff run and which ones are likely to go home early? This article looks at playoff success in terms of regular season results. The big takeaways are:
- Offence matters most of all.
- Goaltending matters too.
- Defence matters a little.
- Scoring talent barely matters at all.
So, if you've built your 105 points on great offense and a good goalie tandem, you're in luck;
and if you've done the same on the back of shot suppression and hot shooting, history is much
less on your side.
Shot Rates
We've seen in the past that shot measures are a good indicator of post-season success, such as Chris Boyle's well-known post exploring unblocked shots in close score situations and playoff success. So, I look first at all shots; that is, blocks, misses, saves, and goals, at 5v5.
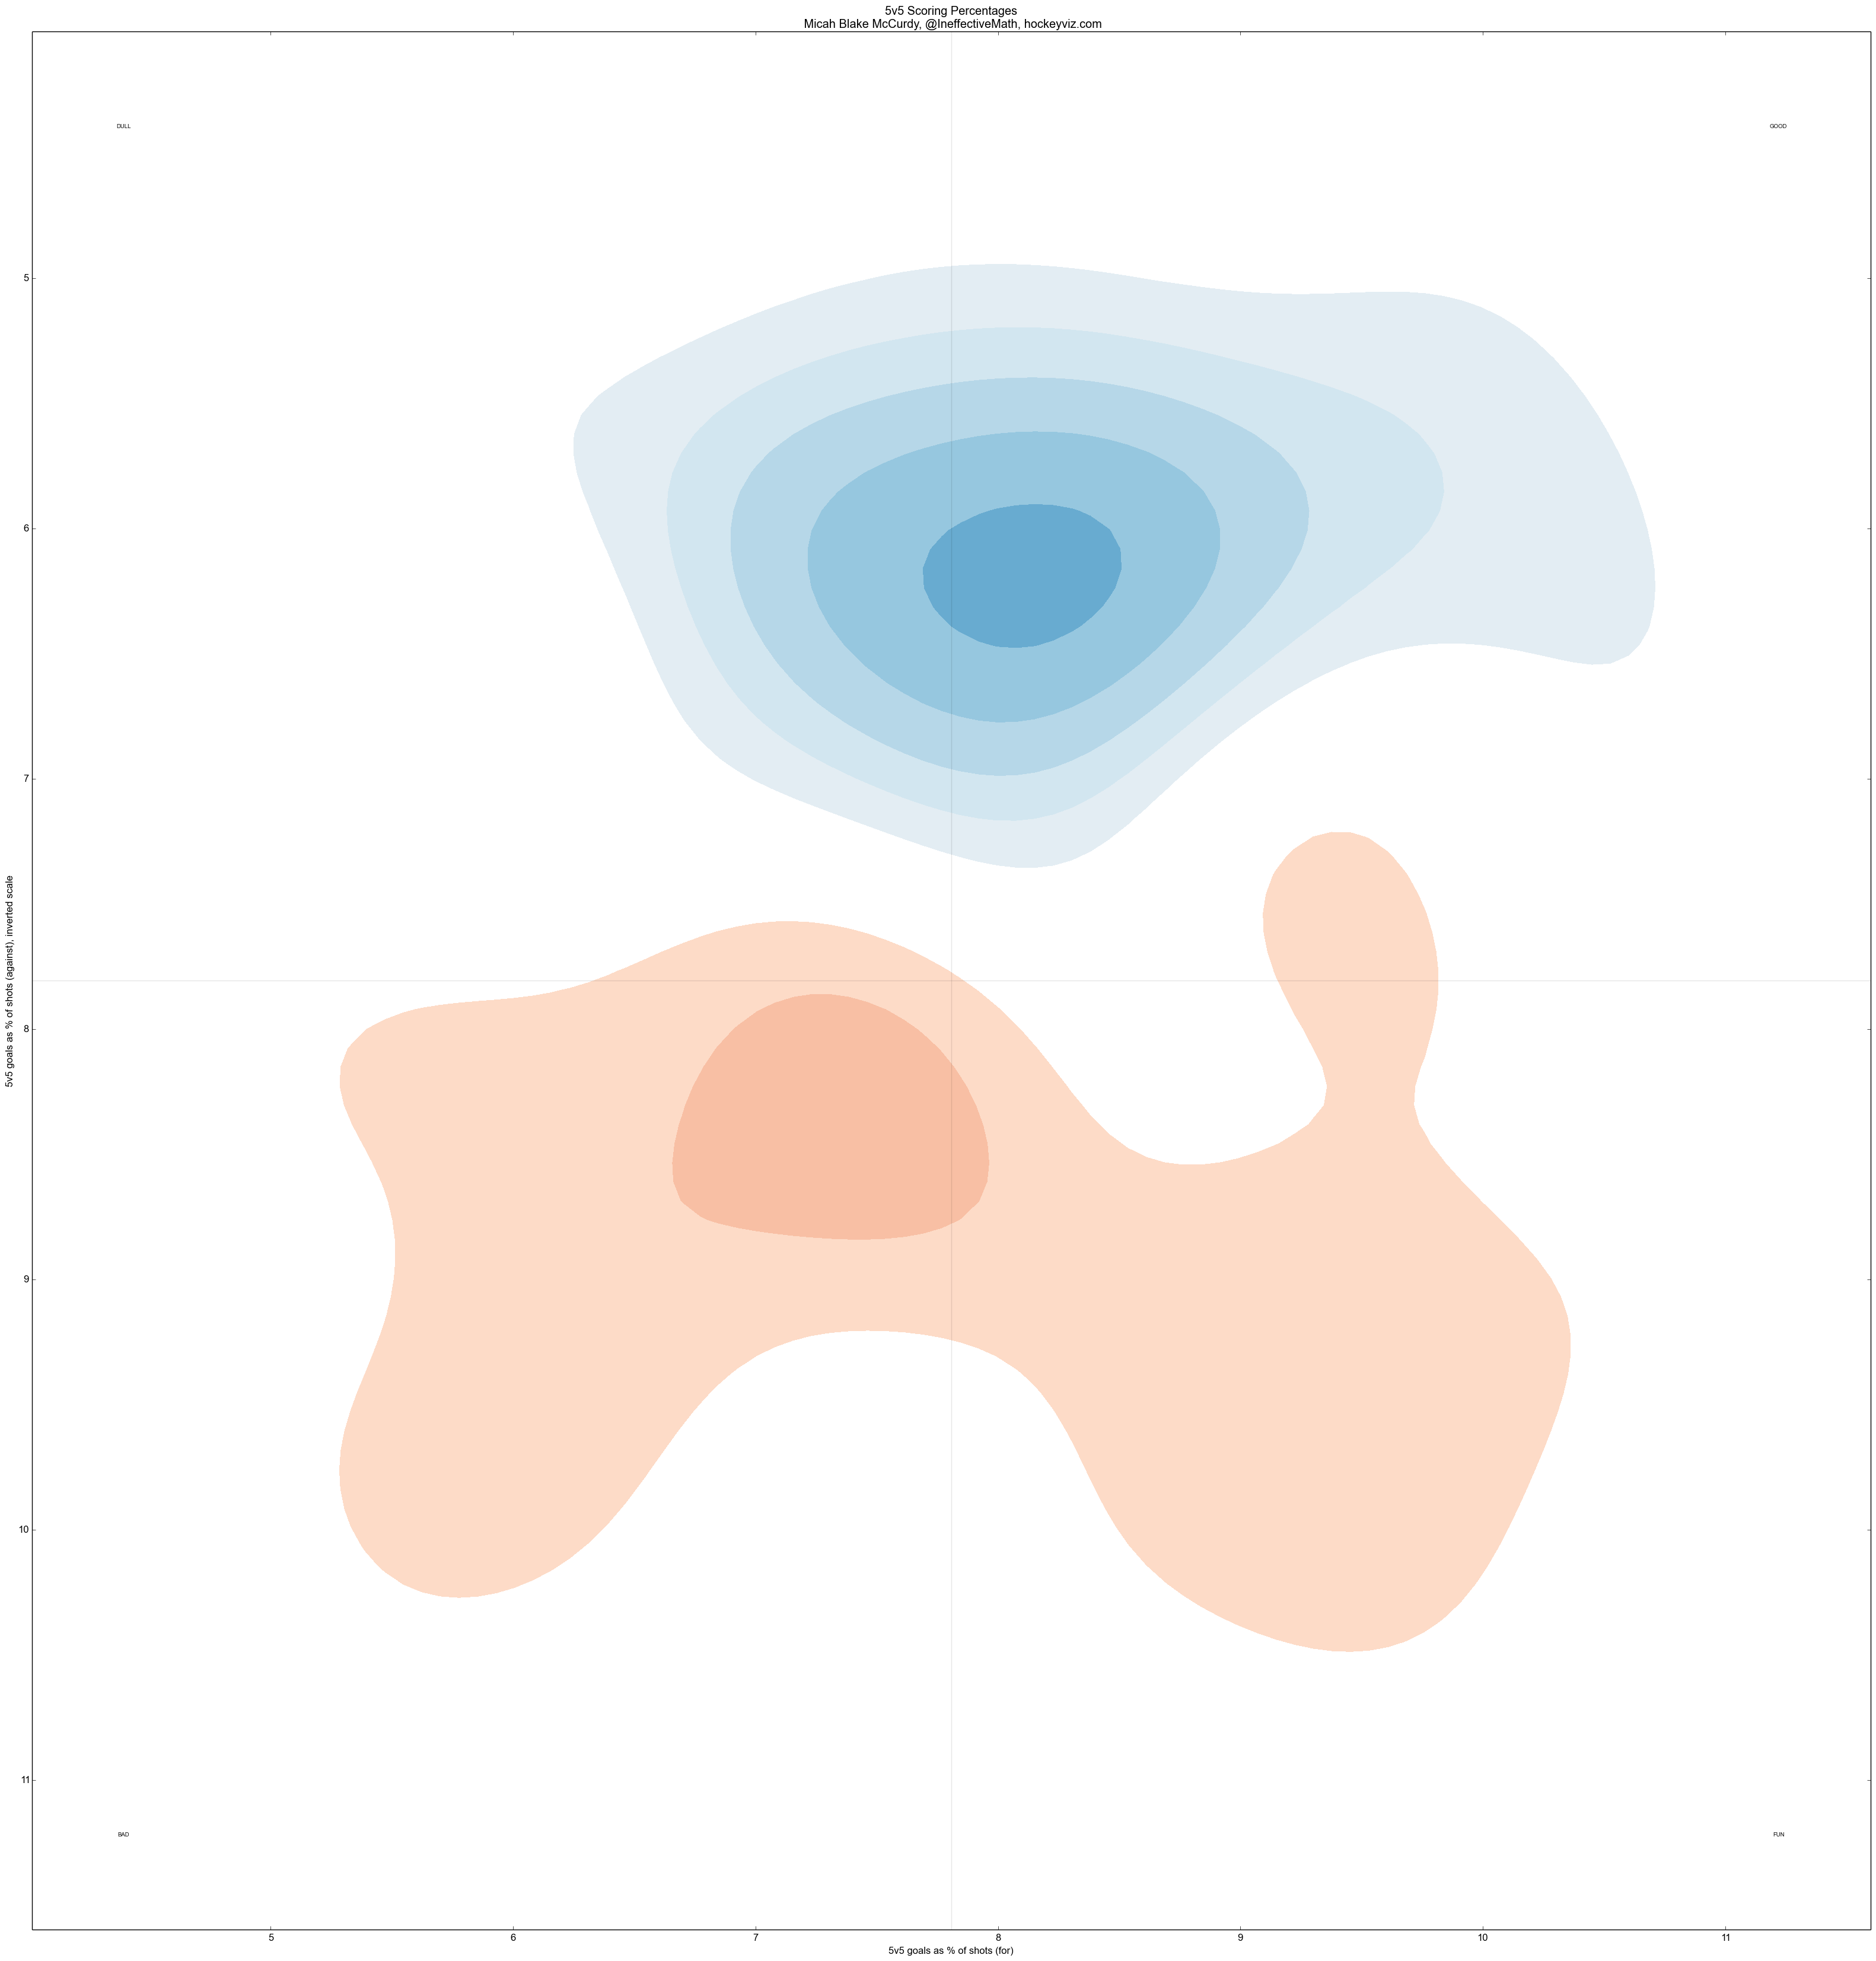
I looked at every regular season performance from 2007-2015. Regions are coloured according to how teams with similar results have performed in the past. Dark blue regions indicate the kinds of regular season results obtained by teams which went on lengthy playoff runs. Dark red regions indicate the kinds of regular season results obtained by teams which didn't make the playoffs at all. Faintly coloured or white regions indicate two differnet kinds of teams. On the one hand, it indicates the kind of results that were middling---some teams like this had some modest playoff success, some missed the playoffs---in the regions between the two darkly coloured patches. On the other hand, it also indicates results that are unlike those of any team we've ever seen, in the regions at the periphery of the figure.
| Season | Recent (Last 25 Games) |
|---|---|
 |
 |
On the left I've shown the results for full seasons; on the right looking only at the final twenty-five games of each season. Unsurprisingly, the blue patch is largely confined to the right (strong shot generation) and to the top (strong shot suppression; note the inverted axes). What is more surprising is that deep playoff runs are characterized more by generation than by suppression.
Especially looking at full-seasons, the historical pattern is that playoff winners are the ones whose regular season results show strong offence, much more so than defence. It's commonly said that coaches and players adopt a more defensive style in the playoffs, and that defense-first teams are the ones who win. The former may or may not be true, but the latter is not borne out by history. In fact, if it is true that teams adopt unusually defensive styles in the playoffs, then naturally gifted offensive teams should be expected to flourish more---what they have is more rare in a defensive environment and therefore dearer, defensive teams' currency becomes worth less when it is commonplace.
Goaltending
Can we tell which teams will perform well in the playoffs by looking at their goaltending results, or by their shooting skill? We repeat the above, replacing shots per hour with goals per shot-on-goal. The x-axis shows shooting results (that is, opposing goaltender results), high values are teams that score on a large percentage of their shots. The y-axis shows goaltending results for; lower numbers indicate fewer goals per shot-on-goal and are shown higher, with an inverted axis as before.
| Season | Recent (Last 25 Games) |
|---|---|
 |
 |
Here we see that good regular season goaltending is crucial---that is, teams with sub-par regular season goaltending have virtually never gone on long playoff campaigns. Shooting talent, on the other hand, appears to mean very little, as the blue patch spreads horizontally through a huge swathe of five standard deviations or so. The blander colours are also a symptom of this spread; we are more sure that a shot-production juggernaut will have a deep playoff run than we are of a team with strong goaltending doing the same.
Conclusion
None of this article looks at what kind of results winning teams put up during the playoffs; that is a story for another day. Looking at regular season results, the historical path to deep playoff runs has been good defence, better offence, and an above-average goaltender.
Technical Appendix
For people who are curious about precisely how the graphs are generated, the process is as follows: Consider a team which made the playoffs with measured results of (x,y), for definiteness, let's say that x is shot generation and y shot suppression, although the process is the same for every graph. Then form the weighted kernel density estimate of all teams who made the playoffs, where every such point (x,y) is given weight 2+w, where w is the number of playoff wins. The offset 2 is chosen so that teams which are swept in the first round are still listed as having some playoff success, that is, slightly more playoff success than a team which did not make the playoffs.
For every team which did not make the playoffs, another kernel density estimate is formed this time with constant weight for each team. I made no distinction between teams that missed the playoffs by a whisker and teams that were abysmal; any attempt to do otherwise strikes me as very difficult to disentangle from the effect of teams that deliberately hurt their short-term prospects in rebuilding efforts.
With these two kernel density estimates in hand, I subtract the "misses" estimate from the "winners" estimate; where the result is positive is shown in blue, where it is negative is shown in red, and where it is very close to zero it is shown in white.