October 3, 2018, Micah Blake McCurdy, @IneffectiveMath
I simulated the 2018-2019 NHL regular season a million times to estimate what is likely to
happen. (I used a computer to help me.) To estimate the probability of the home team winning
each game I used my
prediction model, Magnus.
Curious readers will find lots of detail in those links, but, very briefly:
I estimate the likely rosters for each team, starting from their contract list on
September 29, 2018, and then
weighting by past playing time. Injuries and suspensions are taken into account.
I estimate the individual impact of each player on:
Shot generation and suppression, at even-strength and special teams, taking account
of teammates, competition, and the effects of score, zone, and home-ice deployment;
Rates of taking and drawing penalties
Individual tendencies towards shooting or passing; and
Ability to shoot or stop the puck, as appropriate.
These estimations are done using NHL-gathered input
data from the past two regular seasons, or, when appropriate, using estimates from a
prospect expert (Hannah Stuart).
An adjustment for rest.
The method I used is strongly similar to the one I used last year, with some key
improvements; some of the explanation is copied from last year's preview. First, the
conference totals, and then, below, the division breakdowns, with some commentary.
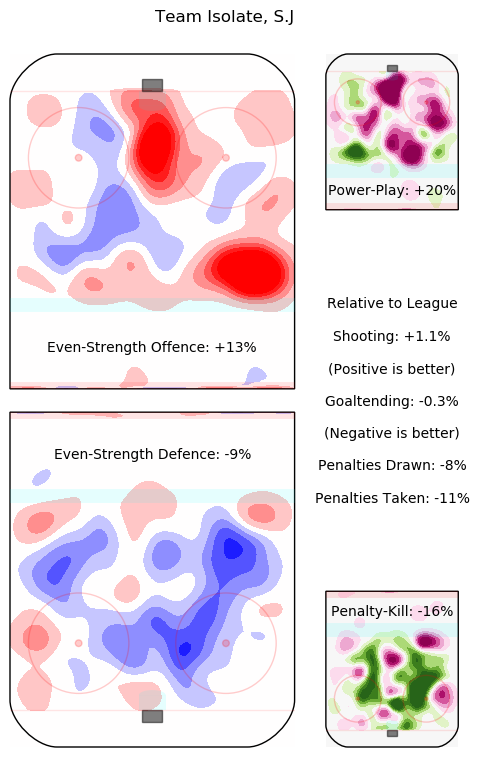
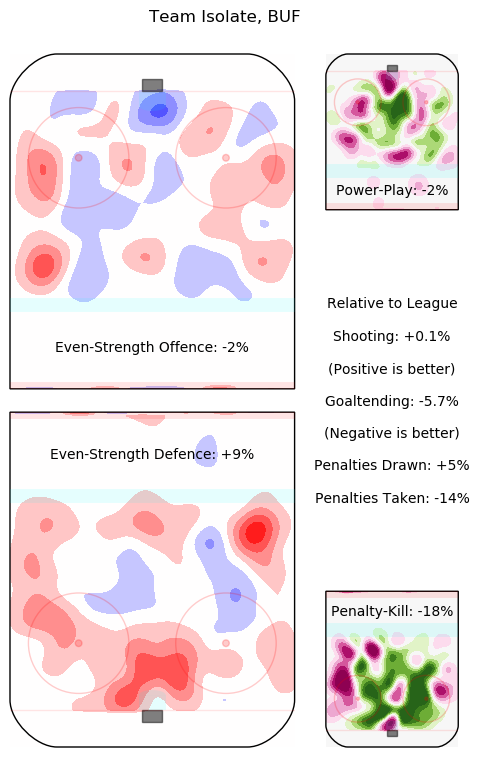
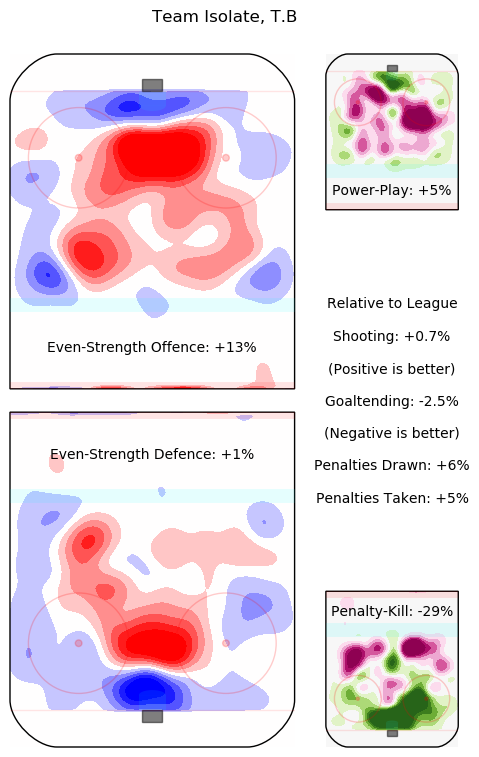
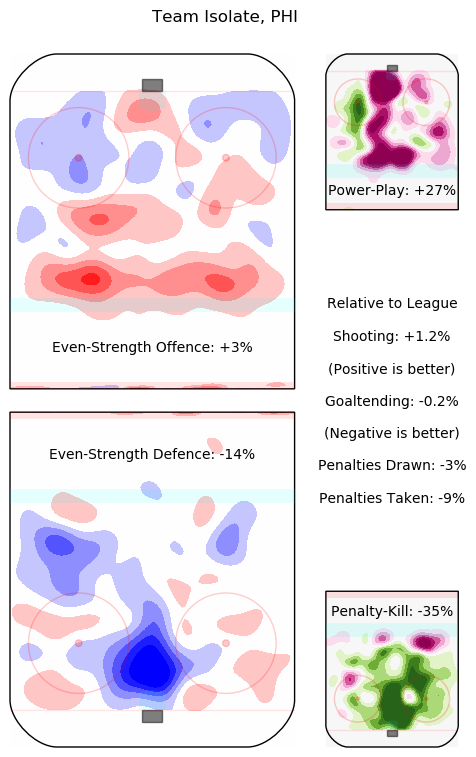
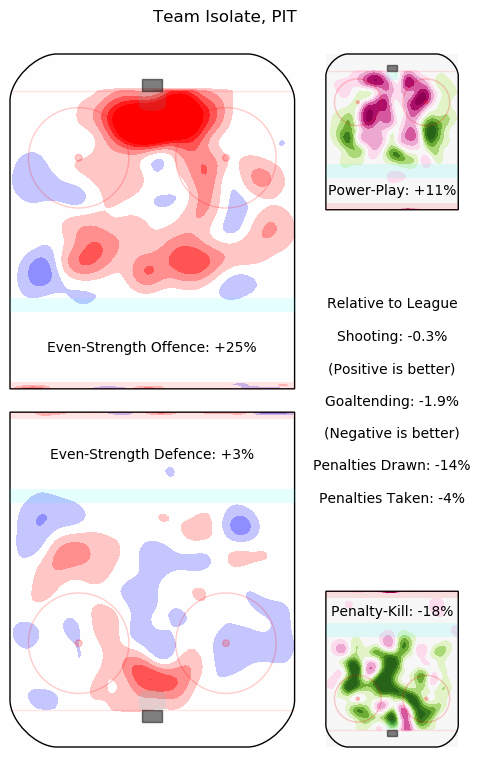
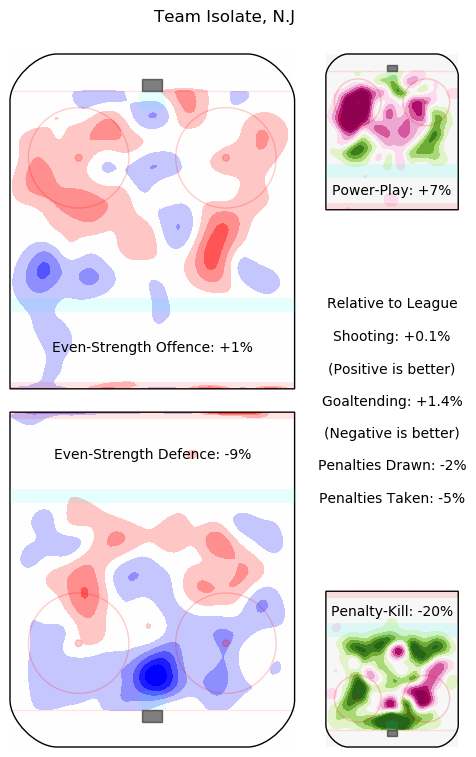
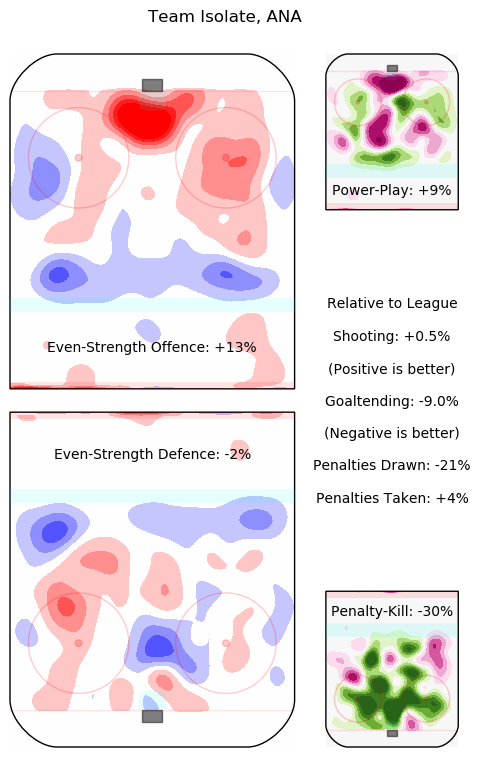
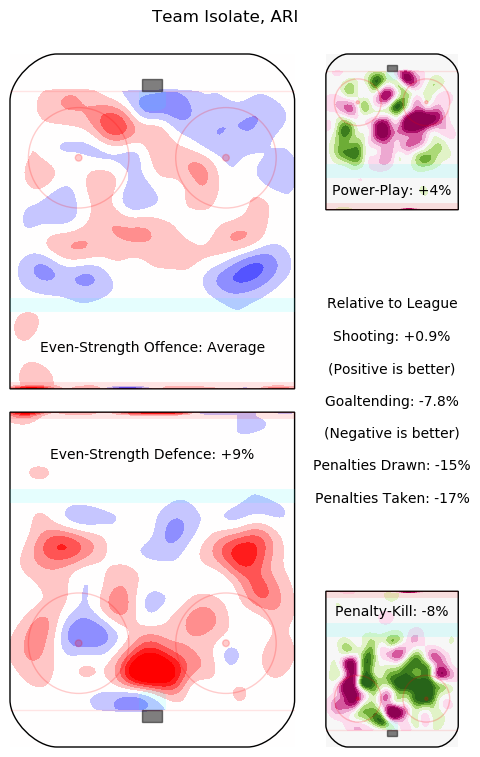
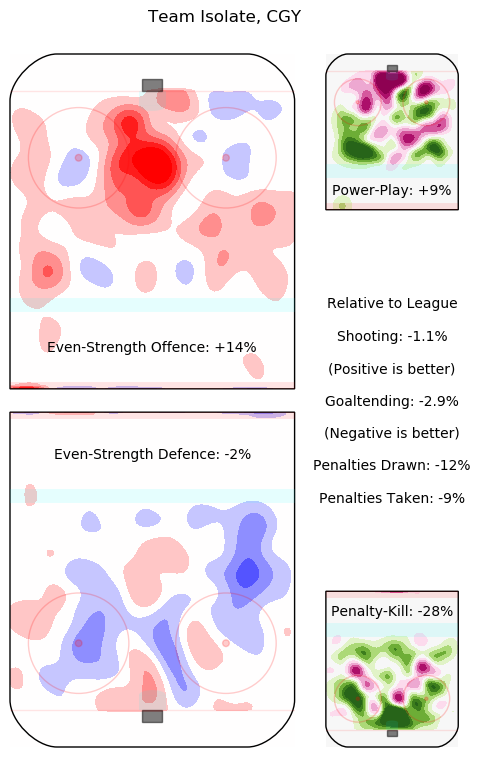
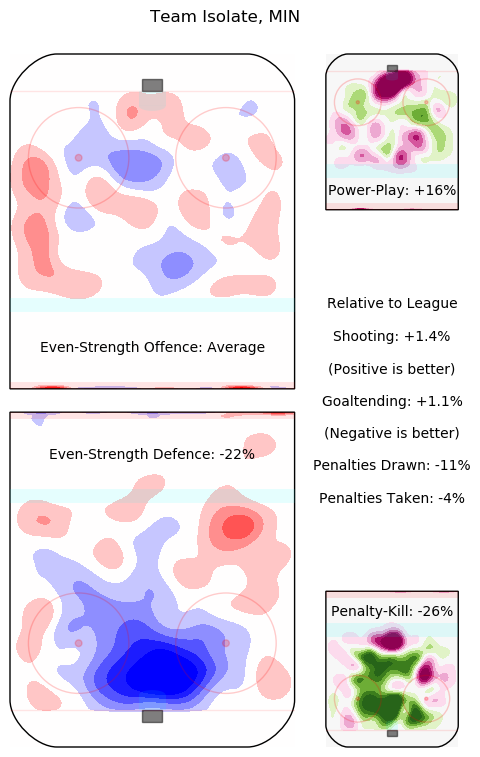
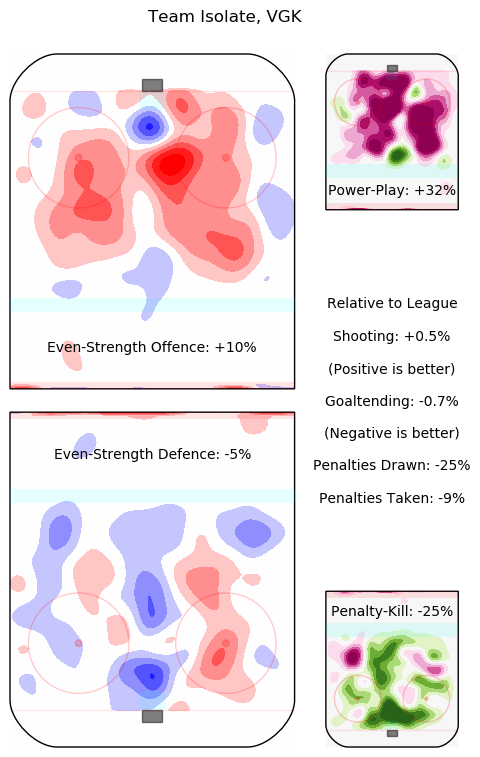
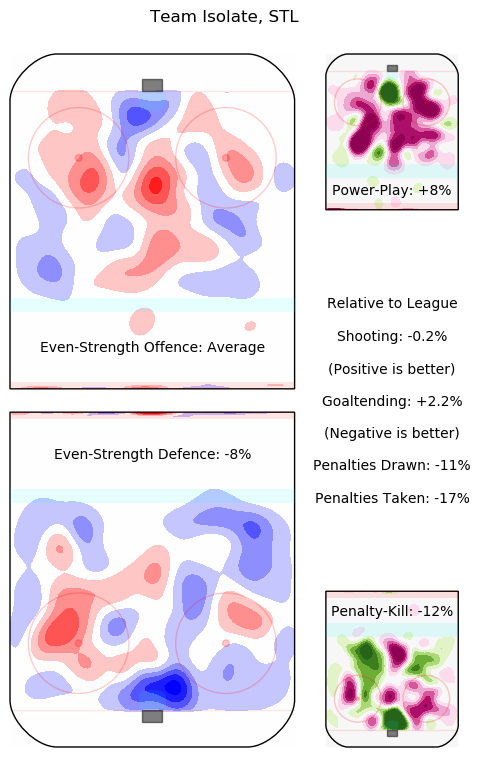
Rather than explain every detail of every graph, I've prepared some "team
estimates", like this one for San Jose. Roughly, this suggests that the offence
in San Jose will continue to be both lethal and concentrated around the net-front and
the right point, the power-play should be well above average and well-structured,
the penalty-kill strong, the 5v5 defence solid. The goaltending estimate is extremely
close to league average, shooting talent slightly better than average, and I expect they
will both draw and take penalties somewhat less than league average.
"Isolates" (as I call them) can be obtained for every team by clicking the links in the
tables below. The individual player estimates, from which they are computed, can be
found on their respective career pages.
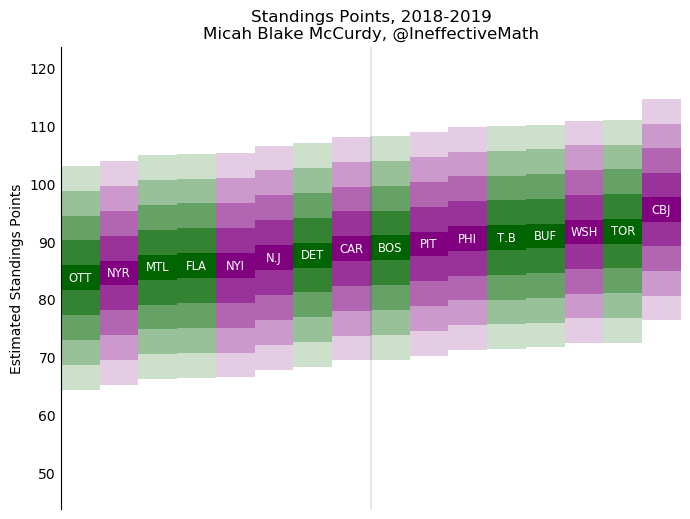
Each team's bar is centred on the average point total obtained in the simulations for each team,
sorted with the highest averages to the right, with the divisions indicated by colour.
The changing colour intensities indicate "stanines", that is, each coloured square shows half
of one standard deviation. The colours themselves indicate division.
Thus, for instance, there is a 20% chance that Toronto finishes with between 89.6 and 92.8 points;
the two adjacent boxes each represent a chance 17%, the next two 12% each, the next two 7% each, and the
extreme pair 4% each. The darknesses of the boxes are chosen to reflect these probabilities.
Thus, we expect around six of the teams to finish in the darkest box, around ten to fall into
the adjacent boxes, around seven to fall into the next pair of boxes, around four into the next
pair, and one or two teams to fall into the faintest boxes. These one or two teams, which I make
no attempt to predict ahead of time, will be much discussed. The proximate cause of their success
or failure will doubtless be a
horrific cavalcade of injuries, like Columbus in 2014-2015, or an exuberance of last-minute
goals and hot shooting, like Calgary in 2014-2015. Part of why I make predictive models is that
I enjoy knowing just how unlikely are the various unlikely things that happen every year.
It is a virtual certainty that the best teams in the league will exceed 100 points, despite
none of their means being above 100. For comparison, consider rolling 31 six-sided
dice—the
chance of obtaining no sixes is very, very small (well under half a percent); but the average
for each dice [sic] is still 3.5
Playoff cutoffs: 88.8 in the Metropolitan, 88.5 in the Atlantic.
Playoff cutoffs: 89.2 in the Pacific, 88.4 in the Central.
Divisional Breakdowns
Atlantic Division
Team
Playoff Chance
Maple Leafs
65%
Sabres
61%
Lightning
60%
Bruins
52%
Red Wings
46%
Panthers
38%
Canadiens
36%
Senators
29%
Every team's most likely finishing position is marked—all three of Toronto, Buffalo,
and Tampa Bay are more likely to finish first in the Atlantic than in any other particular
position, which is another way of seeing just how tight the division is. Buffalo is, I imagine,
the biggest surprise of this preview, their success depends heavily on their goaltending and
their penalty differential, as we'll see below.
Metropolitan Division
Team
Playoff Chance
Blue Jackets
79%
Capitals
63%
Flyers
58%
Penguins
54%
Hurricanes
50%
Devils
43%
Islanders
36%
Rangers
31%
Here the standout is Columbus, driven by all-around strength but especially by Sergei Bobrovsky.
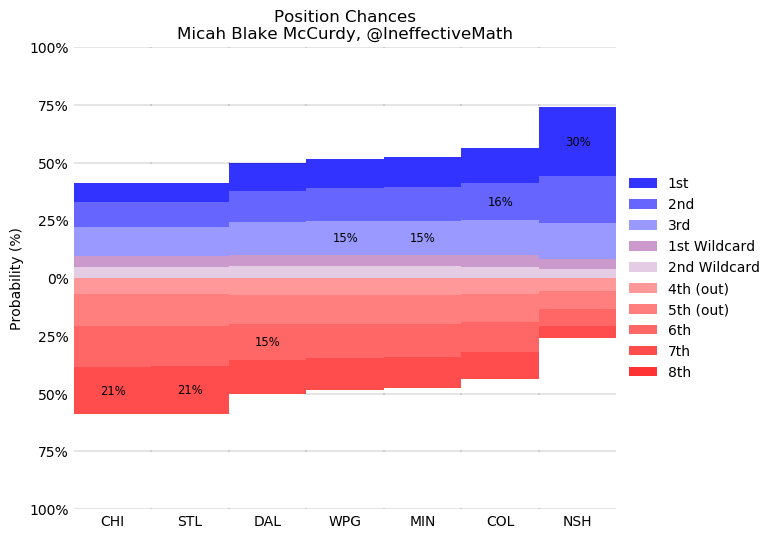
Central Division
Team
Playoff Chance
Predators
74%
Avalanche
56%
Wild
52%
Jets
52%
Stars
50%
Blues
41%
Chicago
41%
Clear standout here is Nashville, driven by their excellent defence corps and goaltending,
especially with Saros ready to fill in should age finally catch up with Rinne. The two weakest
teams in the division have markedly better chances of making the playoffs than the weak teams in
the East, however.
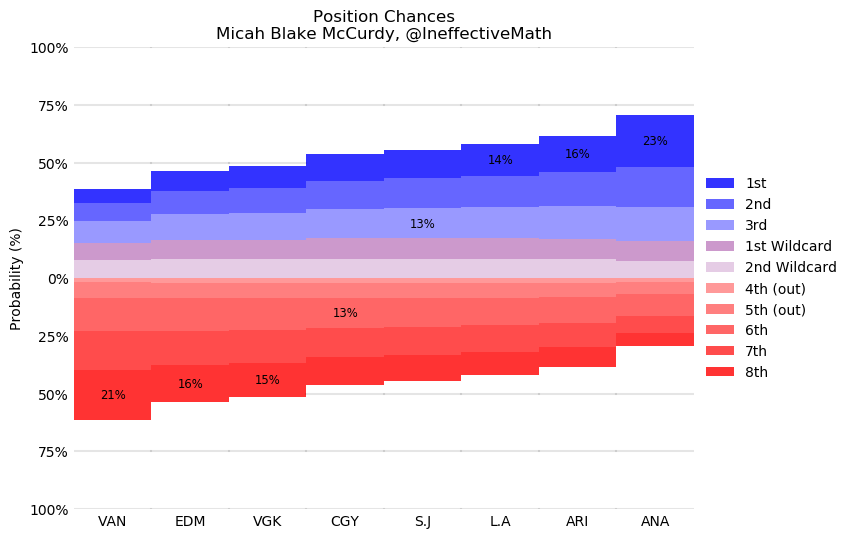
Pacific Division
Team
Playoff Chance
Ducks
70%
Coyotes
62%
Kings
58%
Sharks
56%
Flames
54%
Golden Knights
49%
Oilers
46%
Canucks
39%
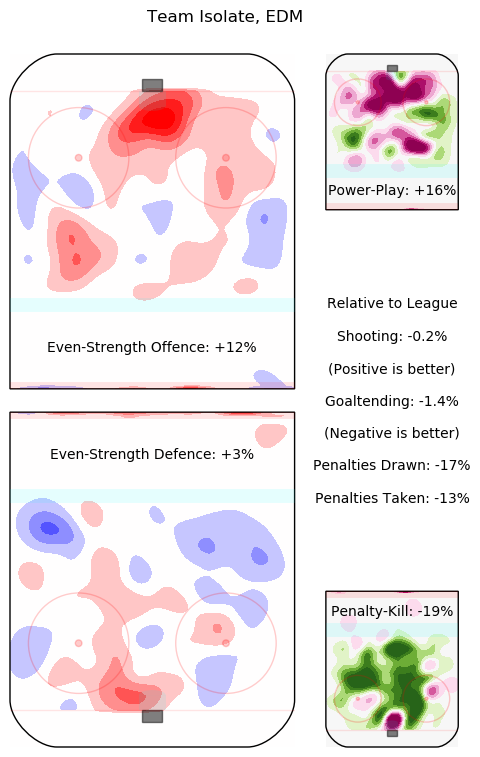
Even with the league's best player, the Oilers still have lots of weaknesses which they
have done nothing to address. Arizona and Anaheim both have extremely strong goaltending, which
I expect will put them close to the top of the division.
Stat Breakdowns
Since my approach is by simulation of games, I can measure many details of how simulated
games play out, and summarize them here. The first two graphs are measures of shot quantity,
weighted by historical shooting percentage from given locations. Teams that routinely generate
shots from good scoring locations will look better, although shooting ability and goaltending
are not considered at this stage.
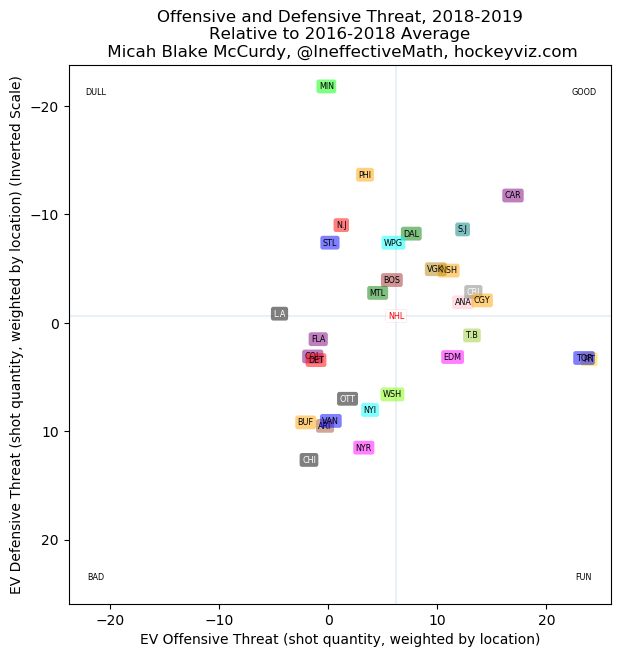
Shot Quantity (Even-Strength)
These are estimates of threat, that is, unblocked shots per hour of even-strength
play, expressed as a percentage of 2016-2018 league average. The two best teams for
generating volume of offence are expected to be Toronto and Pittsburgh (their labels overlap
almost exactly). Conversely, with a similar net benefit, Minnesota are expected to be
extremely strong defensively; Carolina and San Jose are more balanced. The worst teams in
the league by this measure (Chicago, Buffalo, Arizona, Vancouver, both New Yorks, Ottawa) are
much more tightly clumped, proving again the blandness of badness and how much more unique
good teams usually are.
There is an unusual feature of this graph which will re-occur: the average expected
performance is "above average"; most notably the expected offensive threat is considerably
above the zero point. This is confusing at first but makes sense with some though: lineup
estimation is based on past icetime as well as listed rosters, and many of the worst players
have not returned from past years. The new players who will replace injured players this year
will presumably be below 2016-2018 average, but it is beyond my ability to predict which
players will be injured.
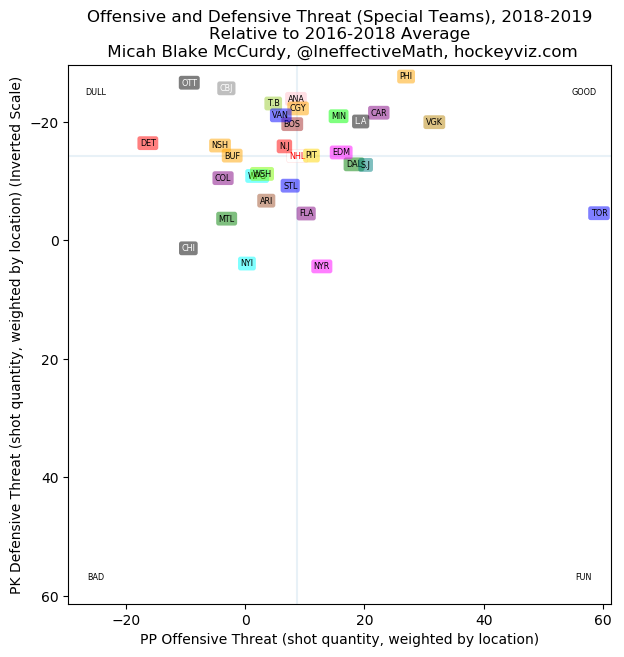
Shot Quantity (Special Teams)
The same measurement above, but for special teams: power-play offence on the x-axis, and
penalty-kill defence on the y-axis. (Power-play defence and penalty-kill offence do not
especially interest me). Here the obvious, ridiculous standout is Toronto's power-play, which
I expect will be very, very good. Such a murderer's row of skater-advantage talent is the
kind of thing I have never seen before in a single team.
Penalties
Expected penalty differentials for teams are computed from expected icetimes for each player,
multiplied by individual tendencies to take or draw penalties. Buffalo benefits strongly from
their addition of Jeff Skinner, who is expected to maintain his sparkling penalty differential.
Noted employer-of-Tom-Wilson Washington Capitals can expect to be short-handed a lot.
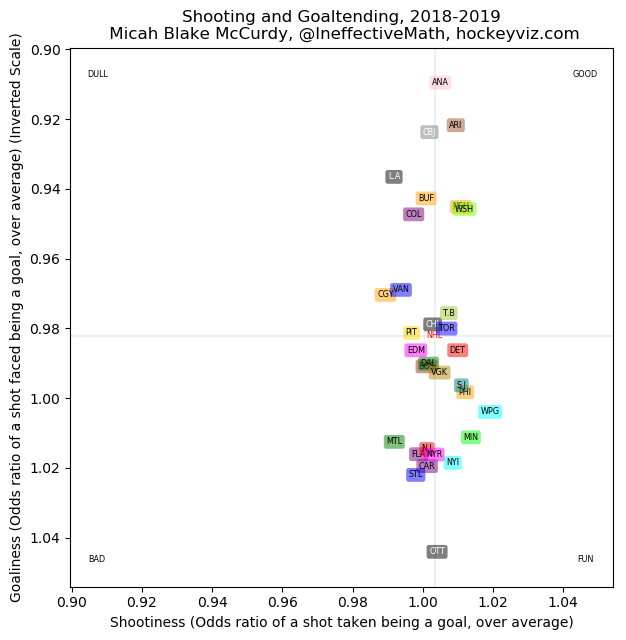
Shooting and Saving
Of unusual importance in this year's model is the impact of goaltending, and, conversely,
shooting talent. The coefficients for goaltender and shooter ability are not as easily
interpretable as the previous measurements, but they can still be understood with odds
ratios; that is, one can compute the ratio of the odds that a goaltender from a given
team will stop a given shot, divided by the odds that a goaltender taken from the league as
a whole from 2016-2018 would stop the same shot. The three best goaltender tandems, (that is,
Anaheim, Arizona, and Columbus) are responsible for a large fraction of their teams' results.
As expected, the variation in goaltender talent (which rests on the shoulders of, at most,
a handful of people per team) is much larger than the spread of shooting talent, which is
derived from many skaters.
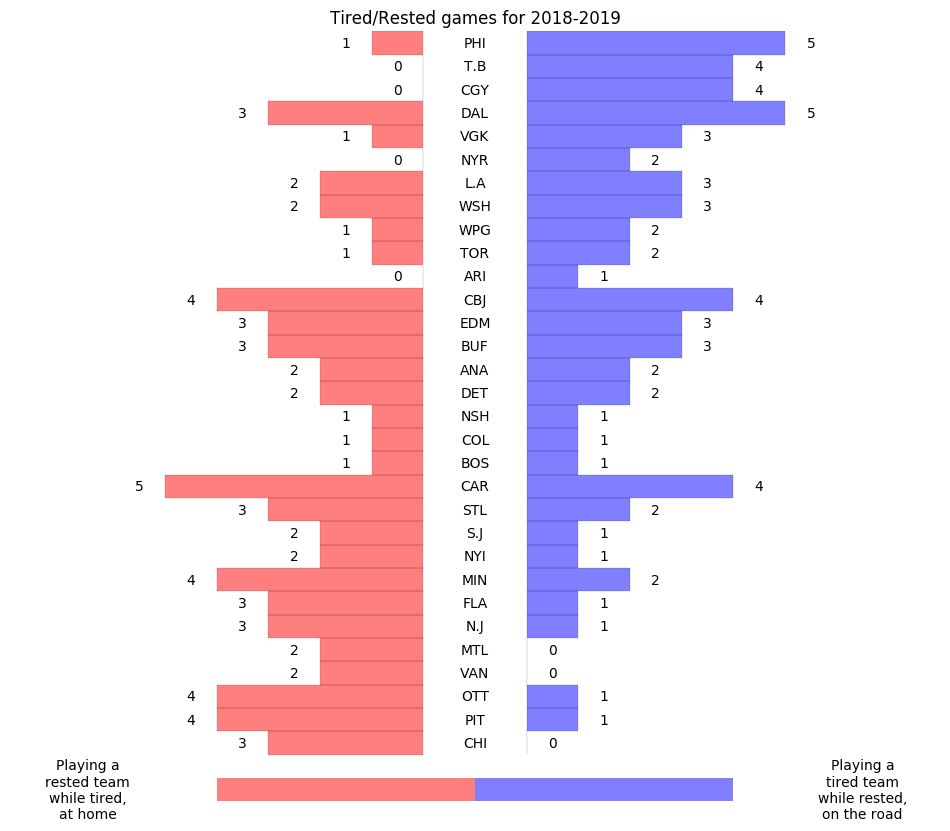
Rest
Not all teams are equally affected by rest.
It's commonplace to highlight games where one team is playing tired (that is, after playing the
night before) and the other team is not. However, in the past substantial deviations from typical
home win percentages are seen only when the team playing at rest disadvantage is the home
team—tired road teams don't seem to be seriously affected. When we restrict our attention
to these games, we see that the variation of rest-affected games is not very large. Benefits are
not confined to teams in a particular area of the continent. Historically, the winning percentage
of such home teams at what I call "rest disadvantage" is roughly as if they were the road team
in the game instead of the away team. Three teams have a net of three such "extra home games",
namely: Philadelphia, Tampa Bay, and Calgary. Only three teams have a matching net deficit,
namely: Chicago, Pittsburgh, and Ottawa.
Wooden Spoon
Since the league still hasn't yet implemented Gold drafting (which guarantees 82 exciting
games for fans of all teams, win or lose), many teams will once again
play many
games at the end of the year which they would rather lose. Although there will be many trades
and confusions between now and the end of the year, these are the early probabilities (including
all three lotteries) for who will get the 2019 first overall draft pick.
Team(s)
Chance of First overall pick
S.J
0%
ANA, CBJ, NSH
1%
ARI, BUF, L.A, PHI, T.B, TOR, WSH
2%
BOS, CAR, CGY, DAL, MIN, OTT, PIT, VGK, WPG
3%
CHI, DET, EDM, N.J, STL, VAN
4%
FLA, MTL, NYI
5%
NYR
6%
7%
8%
COL
9%
The above includes the Duchene trade (which sent the Senators first-round pick to Colorado,
hence their "high" chance of picking first, since they also have their own pick) and also
the Karlsson trade, which sends the San Jose first-round pick to Ottawa if the Sharks miss
the playoffs.
Weaknesses
In a broad sense I am extraordinarily pleased with Magnus, which I feel represents an
enormous improvement over my previous work. On the other hand, the various sub-models and the
overall approach has any number of weakness, which I know better than any other, so it
behooves me to outline some of the salient ones here.
Most importantly, player aging is not explicitly included, so players under the age of
twenty-four or so
will be slightly underrated here and players over the age of twenty-six or so will be slightly
overrated. I consider only results from the past two years in part to try to detect aging effects,
but teams with lots of young players will likely overperform their estimates here and teams with
heavy icetime to older players vice versa.
Furthermore, I wonder if certain pairs of players may exhibit chemistry, that is,
produce good results with one another that they would not produce in like measure if they were
to play with different players. Such non-linear effects are not considered here. More broadly,
it may be that offence and defence may be of fundamentally different characters that it may
not be appropriate to model them as at all similar, despite their obvious dualities—for
instance, some have suggested that team offence might be modelled as the sum of the offensive
abilities of all players (as I have done here) but perhaps team defence might be modelled as the
minimum ability of the players, or some suchlike thing. Such non-linear possibilities
are also not considered here.
More subtly and more specific to this year, I harbour my own doubts about the certainty
with which goaltender results can be
predicted, and their impact strikes me as a possible weakness. However, as I outline in my
model description, a good simulation model does not allow
for tinkering with relative weights—the relative weights are simply as they emerge from
simulating processes as faithfully as possible. Simulating complex systems is a delicate business
and I shall simply have to gird my lobes and trust to my methods.


