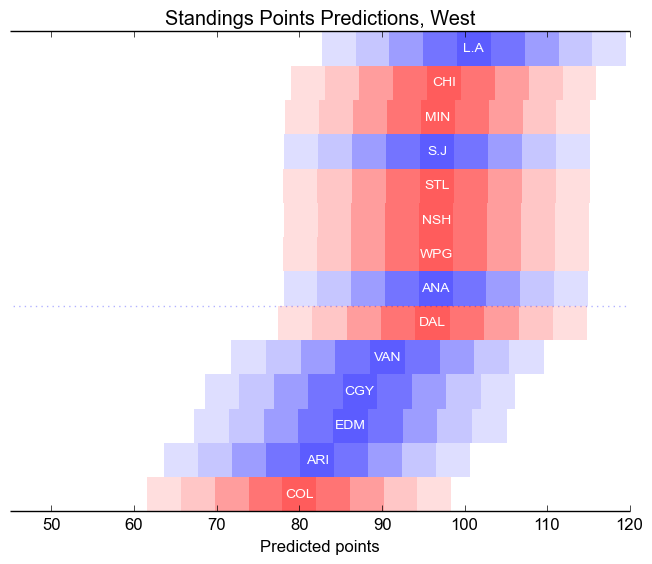
I have built a new predictive model for single games and my first task for it is to simulate the 2015-2016 NHL season. Running ten thousand simulations gives me not just a decent estimate of the final standings points, but also of the likely spread of possibilities. Let's have the results first and then the methodology afterwards. Ten thousand may not seem like very many simulations, but the measured variance is similar to that obtained with millions of simulations.
Season-ending Standings Points
|
| ||||||||||||||||||||||||||||||

|
| ||||||||||||||||||||||||||||||||||
Each bar is centred on the average point total obtained in the simulation for each team, ordered from top to bottom, with the divisions indicated by colour. The changing colours indicate "stanines", that is, each coloured square shows half of one standard deviation. Thus, for instance, there is a 20% chance that Ottawa finishes with between 89.2 and 93.4; the two adjacent boxes each represent a chance 17%, the next two 12% each, the next two 7% each, and the extreme pair 4% each.The colours of the boxes are chosen to reflect these probabilities.
The tables show the mean number of points obtained by each team over the many simulations.
Thus, we expect around six of the teams to finish in the darkest box, around ten to fall into the adjacent boxes, around seven to fall into the next pair of boxes, around four into the next pair, and one or two teams to fall into the faintest boxes. These one or two teams, which I make no attempt to predict ahead of time, will be much discussed. The proximate cause of their success or failure will doubtless be a superhuman goaltending performance, like Carey Price in 2014-2015, or a horrific cavalcade of injuries, like Columbus in 2014-2015, or an exuberance of last-minute goals and hot shooting, like Calgary in 2014-2015. Part of why I make predictive models is that I enjoy knowing just how unlikely are the various unlikely things that happen every year.
Method
I conducted the simulations using my new predictive model, Oscar. As discussed in detail there, Oscar is built out of:
- 5v5 unblocked shot generation and suppression (aka, "Fenwick")
- Individual career 5v5 goaltending
- Team shooting percentage
- 5v4 shot generation
- 4v5 shot suppression
- Home ice advantage
The relative importance of the terms can be found in that article. For this season preview, I used full-season measurements from last year for all features except goaltending. For goaltenders, I made rough estimates of how the workload would be shared between the two likeliest goalies for every team as of October 5, 2015. For every game to be predicted, I flipped a suitably weighted coin to choose which goaltender was expected to start and used their statistics.
After using Oscar to predict the probability of the home team winning each game, I randomly chose a winning type, weighted as 75% regulation, 10% overtime, 15% shootout. Ties were broken using the regulation and overtime wins and then by coin flip.
Model weaknesses
Roster changes for skaters are not considered. To do so would require a much more sophisticated model that estimated team talent from estimates of individual player talent. New players, such as McDavid and Eichel, are not included for this reason. Similarly, aging effects are not considered. Coaching effects and in-game dynamics are obviously not considered, so things like relative sensitivity to score effects are not included. Penalty drawing and taking are not included.
I am developing an extremely ambitious model, named Simeon, that should take into account all these things. Simeon will be a simulation model, whose output is a range of possible game scores, with relative likelihoods, instead of a probability of a home win. It should be ready for the 2016-2017 season.
Covariate values for Preview
In rough order of model importance, here are the measured values of the model covariates for all thirty teams. The teams have been spread out horizontally so that they can be distinguished, and some of the y-axes have been inverted so that better results are always higher up.
5v5 Unblocked Shots
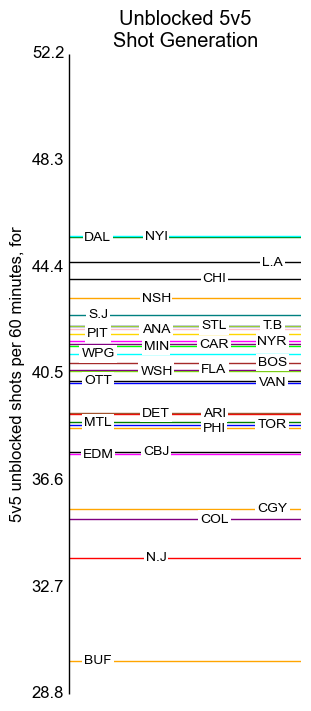
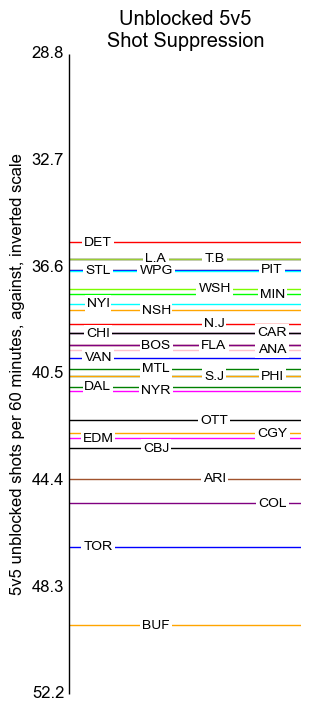
The axis labels indicate standard deviations, centred around the mean of 40.5 per sixty minutes.
Shooting and Goalie Talent
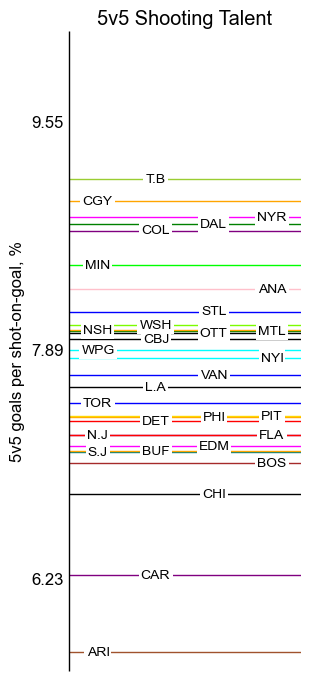
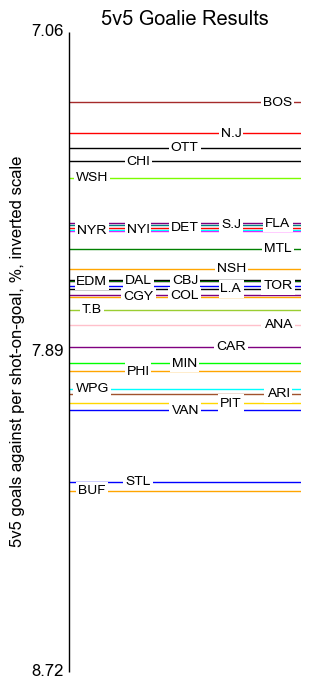
The shooting talent labels are placed at standard deviation intervals.
The goalie labels show the mean and plus-and-minus one half of one standard deviation. This tightness, and the skew above the mean, can be explained by several things. First, the mean and standard deviation are computed over the training set of the model, and current goalie talent is both better and more narrowly distributed than in the past. Furthermore, teams generally deploy their best goalie talent at the beginning of the year, bringing in weaker goalies as necessitated by injury.
The goalie figures are computed by taking the weighted average of the diluted 5v5 goals per shot-on-goal, as described in the Oscar description page. The weights are my rough guesses as to how the workload will be deployed; all pairs are assumed to be split 70% / 30% except:
- Hiller 60% / Ramo 40% in Calgary,
- Howard 60% / Mrazek 40% in Detroit,
- Bernier 60% / Reimer 40% in Toronto,
- Pavelec 60% / Hutchinson 40% in Winnipeg, and
- Schneider 80% / Kincaid 20% in New Jersey.
Special Teams
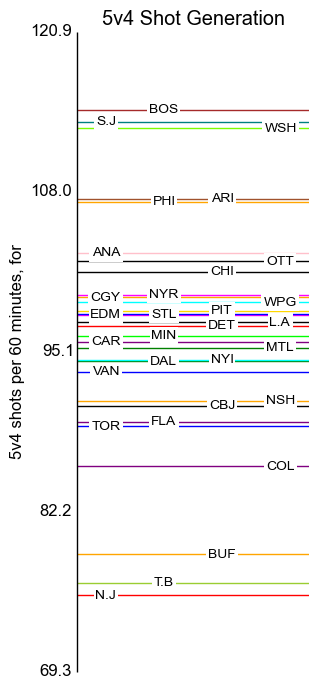
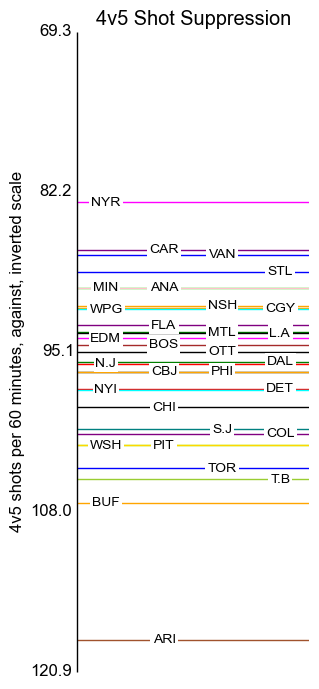
The axis labels here are placed at standard deviation intervals.