How to read Shot Pressure Diagrams
Each diagram shows when each team generated shots during a single game.
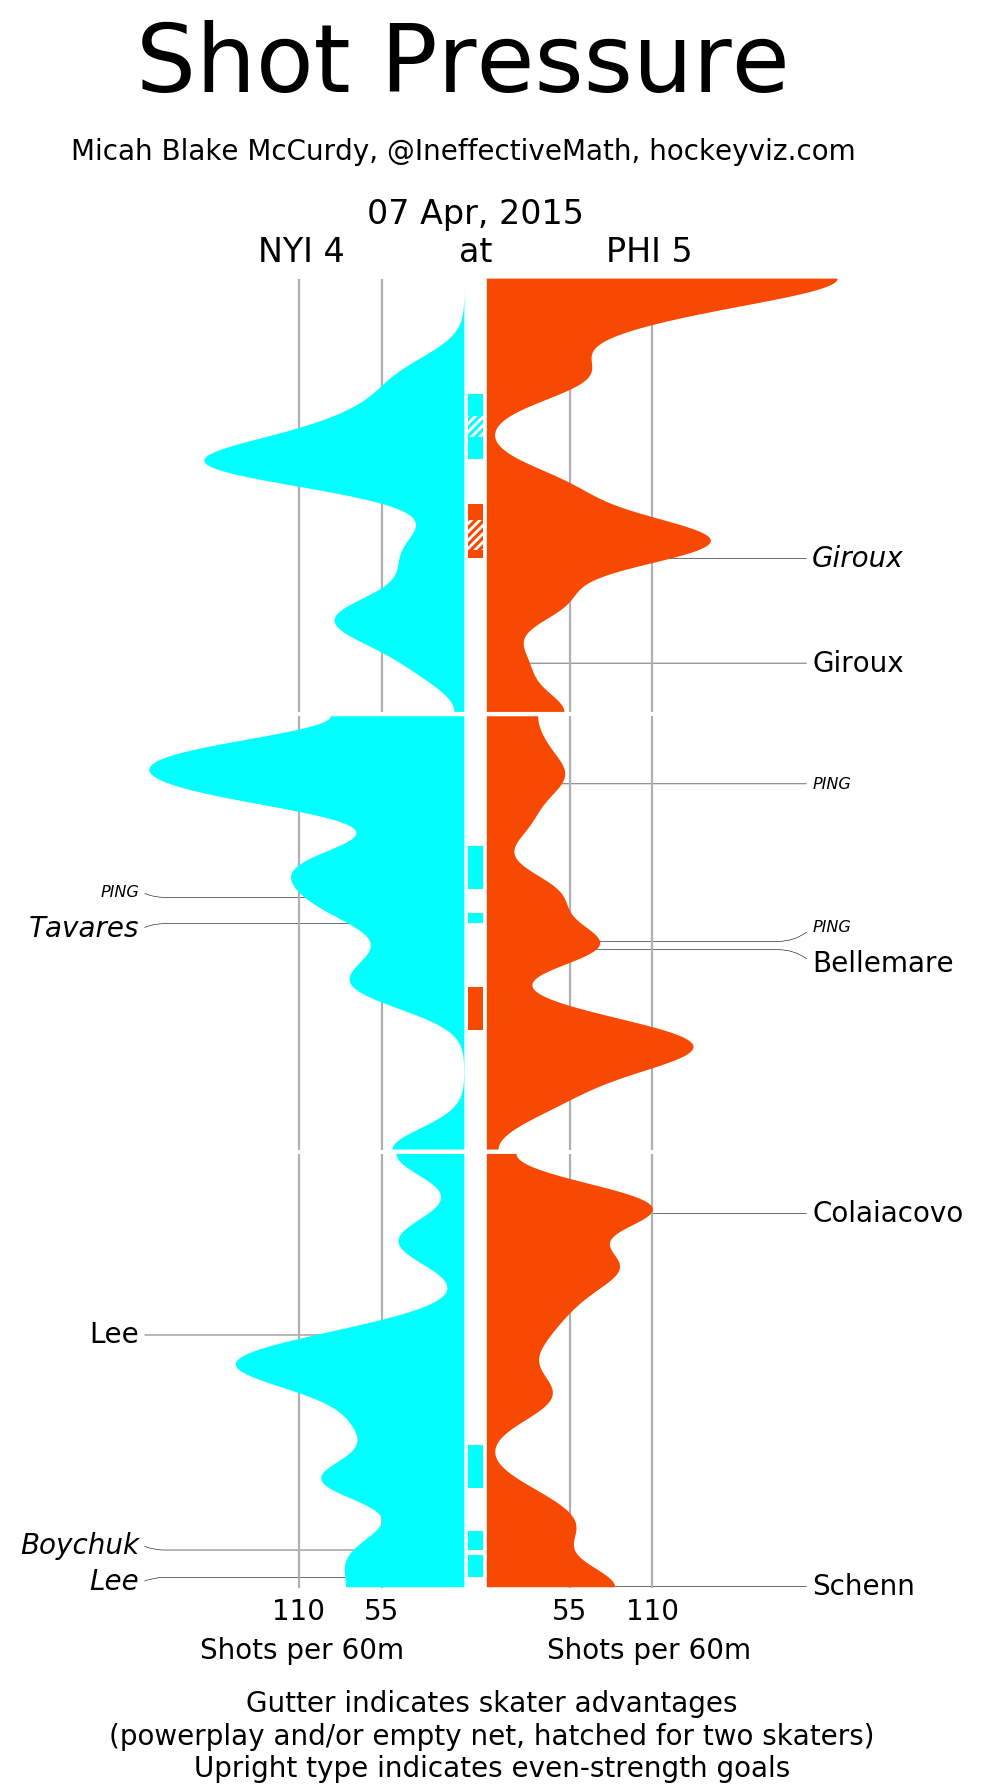
The diagram is separated into sections, one for every period. Time flows downwards; this example is a regulation win for the Flyers, shown to the right, over the Islanders, shown to the left. The goalscorers are shown with callouts, so in this example Giroux scored twice for the Flyers in the first; in the second Tavares scored for the Islanders and was almost immediately answered by Bellemare; in the third the Flyers scored early but then Anders Lee scored midway through the third; Boychuk and Lee scored again to tie the game late in the third but Schenn won the game for Philadelphia in the last seconds.
The blue coloured regions indicate times when the given team was generating lots of shots---shots here are all shots, blocked, missed, saved, or goals. Instead of showing each shot as a line at the second it was taken, I replace each shot with a narrow bell curve centred at that point, then I add up all of these bell curves for a given period. This is an example of the smoothing method which I use in many of my charts.
This smoothing means that when many shots are generated in quick succession, the blue region will be large. In this game, Philadelphia came storming out of the gate, only for momentum to shift sharply to the Islanders before shifting back to the Flyers around the time of the first Giroux goal. Most goals are scored, as you would expect, at or soon after a peak in shot pressure.
The grid lines show 55 shots per 60 minutes and 110 shots per 60 minutes, roughly league average and double that. This was a high-event game, with both teams spending most of the game above league average. The first Lee goal, for instance, was scored during a time when the Islanders were generating shots at a rate roughly double that of league average and they continued to increase the pressure after that goal.
Darker regions show when one team had more skaters than the other, because of penalties or because of pulling their goalie for an extra skater. Different kinds of numerical advantages are not distinguished.